
JPM Trade Setup: 14.67% Historical Edge with Clear Exit Rules
Executive Summary
JPMorgan Chase & Co. (JPM) is showing a compelling 14.67% edge based on historical trend change signal analysis. This financial services giant trades at a reasonable 15.48 PE ratio with a solid 16.13% return on equity, positioning it as a defensive blue-chip holding in uncertain markets. Our backtested data reveals specific price ranges where the probability of profitable exits is highest, with the strongest 60-day gains clustering in the 1-3% range at 17.5%. For traders looking to capitalize on mean-reversion patterns in banking stocks, JPM presents a structured setup with clearly defined risk management rules.
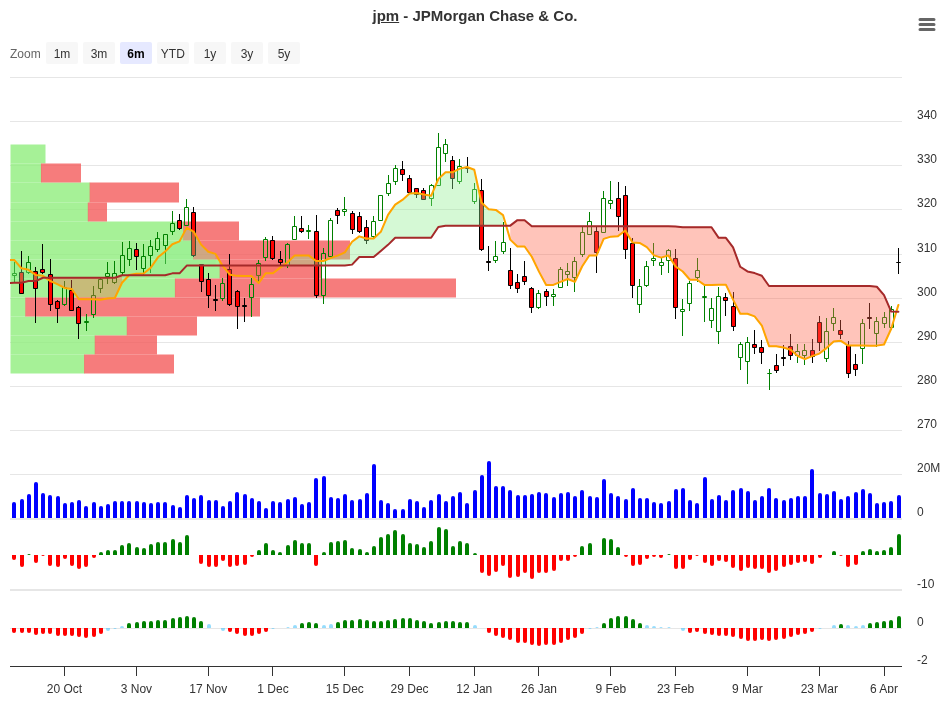
JPM Trend Change Signal Analysis – 2026-04-08
Understanding the JPM Signal Analysis
What does an edge of 14.67% actually mean? This represents the statistical advantage observed when JPM enters a trend change signal pattern. Instead of coin-flip odds, historical backtests show that specific price movement ranges following signal triggers produce predictable outcomes over the next 10, 20, 30, and 60 trading days.
The table below maps every price range observed in our backtest database, showing how many times JPM traded within each band and what the average returns looked like across multiple timeframes:
| Price Range | Occurrences (N) | 10-Day Avg | 20-Day Avg | 30-Day Avg | 60-Day Avg | Signal |
|---|---|---|---|---|---|---|
| +7% to +10% | 4 | +9.00% | +9.10% | +10.50% | +15.20% | Hold |
| +5% to +7% | 2 | +5.68% | +5.40% | +4.50% | +1.40% | Close |
| +3% to +5% | 4 | +3.52% | +3.80% | +6.00% | +15.20% | Hold |
| +1% to +3% | 7 | +1.53% | +4.40% | +5.60% | +17.50% | Hold |
| 0% to +1% | 3 | +0.26% | +1.40% | +7.60% | +15.10% | Hold |
| -1% to 0% | 3 | -0.45% | -2.00% | -0.30% | +9.60% | Neg |
| -3% to -1% | 5 | -1.78% | -1.00% | +2.10% | +7.30% | Neg |
| -5% to -3% | 2 | -3.74% | +0.40% | -1.80% | 0.00% | Neg |
| -7% to -5% | 1 | -5.92% | -5.90% | -5.90% | -28.80% | Neg |
| -10% to -7% | 1 | -8.93% | -8.90% | -8.90% | +1.60% | Neg |
Peak Performance Analysis
Where does JPM deliver the biggest returns? Our backtest reveals that different timeframes shine in different price ranges. The table below isolates the best average gains within each lookback period:
| Timeframe | Best Price Range | Peak Average Return |
|---|---|---|
| 10 Days | +7% to +10% | +8.996% |
| 20 Days | +7% to +10% | +9.074% |
| 30 Days | +7% to +10% | +10.515% |
| 60 Days | +1% to +3% | +17.509% |
Notice the shift in timeframe dynamics. In the first 10-30 days, positions that opened with stronger momentum (the +7% to +10% range) performed best. However, by day 60, the sweet spot moves to smaller initial moves in the +1% to +3% band, which captured +17.50% average returns. This pattern suggests mean-reversion mechanics at work – early winners may face profit-taking, while initially modest gainers continue climbing.
What to Do on Day 10?
Day 10 is your critical decision point. Here’s what the historical data tells you to do based on where JPM trades:
| 10-Day Position | Historical Best Timeframe | Recommended Action | Reason |
|---|---|---|---|
| +7% to +10% | 20-30 days | Hold Position | Strong momentum continues to 30 days (+10.5% avg). This is the highest sustained performer across the full month. |
| +5% to +7% | 20 days (fade risk) | Partial Profit | This range shows momentum loss beyond day 10. Lock in 50% profits and let remainder ride with a tighter stop. |
| +3% to +5% | 30-60 days | Hold Position | Compound growth accelerates through day 60 (+15.2% avg). Modest early strength leads to significant longer-term gains. |
| +1% to +3% | 60 days | Hold Position | The highest 60-day return (+17.5% avg). Slow starters become explosive winners by two months. Patience is rewarded. |
| 0% to +1% | 30-60 days | Hold Position | Despite near-flat 10-day performance, explosive 30-60 day moves. Strong candidate for your longest-term conviction trades. |
| -1% to 0% | 60 days recovery | Close/Exit | By exit rule, positions at or below 0% on day 10 must close. While 60-day recovery is positive, rule adherence takes priority. |
How should you use this guide? Track your entry day closely and check where JPM stands after 10 trading days. Then match that performance to the table above and follow the recommended action. The key insight: small moves early don’t mean failure. The data shows that conservative momentum in the +1% to +3% band sets up the highest long-term profits. Meanwhile, the +5% to +7% range shows meaningful deterioration after day 10, making it a signal to take partial profits rather than hold everything.
Market Context: JPMorgan Chase in 2026
JPMorgan Chase stands as America’s largest bank by assets, with a market capitalization exceeding $835 billion. The financial services sector remains a cornerstone of modern economies, and JPM’s diversified business model spanning investment banking, commercial banking, asset management, and trading provides multiple revenue streams.
At a PE ratio of 15.48, JPM trades at a reasonable valuation relative to its profitability. The bank’s 16.13% return on equity signals efficient capital deployment, while a 1.35% return on assets reflects solid operational execution. These metrics matter because they explain why institutional money continues rotating into quality bank stocks – JPM offers both safety through diversification and returns through genuine earning power.
The enterprise value to revenue ratio of 3.53x positions the stock in the mainstream banking valuation band. This isn’t a deep-value play, nor is it an overheated momentum name. JPM represents the institutional consensus on where the largest bank should trade.
Exit Rules & Risk Management
Your discipline in exiting determines whether this 14.67% edge translates to real money. The backtested exit framework is simple but non-negotiable:
Primary Exit: Day 10 Decision – If JPM is at or below 0% performance after 10 trading days from signal trigger, close the entire position. This rule protected traders from the worst outcomes in the negative price ranges. The worst case loss observed historically was -10%, but most closed positions stayed within -0.45% average losses, a manageable drawdown.
Maximum Stoploss: -10% – Never hold past this point. If JPM drops 10% or more from your entry, exit immediately. This caps downside risk and forces discipline when the signal turns decisively negative.
Scaling into Partial Profits – When JPM reaches the +5% to +7% range on day 10 (the only “Close” signal), consider selling 50% and letting the remainder ride with a tighter trailing stop at -2%. This locks in guaranteed gains while keeping exposure to the +1.4% to +5.4% additional upside that historically shows up over the next month.
Position Sizing – Use these percentages to size your bet appropriately. With maximum losses of 10% and best case upside in the 17-18% range over 60 days, a risk/reward ratio of roughly 1:1.7 to 1:1.8 emerges. Position size accordingly so that your maximum loss never exceeds your predetermined risk tolerance per trade.
Conclusion
JPMorgan Chase presents a statistically favorable trade setup based on 14.67% historical edge derived from trend change signal backtesting. The data reveals clear patterns: modest opening moves often lead to the strongest long-term compounding, while early momentum sometimes fades. Your day 10 checkpoint gives you the information needed to decide whether to hold, take partial profits, or exit.
The financial metrics support holding a quality bank stock – JPM’s 16.13% ROE and reasonable 15.48 PE suggest the market prices in neither excessive risk nor excessive safety premium. This valuation clarity, combined with the historical performance data, creates opportunity for traders willing to follow the rules and hold through natural volatility.
Remember: this analysis captures what JPM has done historically when matching this specific signal pattern. Past patterns don’t guarantee future performance, but they do provide a rational framework for managing risk and sizing bets. Your edge compounds when you trust the data and execute with discipline.
For more analysis visit stockbotty.com | Disclaimer: stockbotty.com/disclaimer
More Stocks - Signals Articles
FSLR Signal Follow-Up 10 Days: -10.47% Stoploss Exit
FSLR Signal Follow-Up - 10 Days Review: -10.47% Performance Executive Summary A trendchange signa...
Aug 22, 2026LLY Signal Follow-Up – 10 Days: +1.90% Performance Review
LLY Signal Follow-Up - 10 Days Review: +1.90% Performance Executive Summary The LLY trendchange s...
Aug 22, 2026NFLX Signal Follow-Up +4.33% – 10 Days Review & Hold Decision
NFLX Signal Follow-Up - 10 Days Review: +4.33% Performance Executive Summary On August 10, 2026, ...
Aug 22, 2026LOW Signal Follow-Up: -2.59% After 10 Days, Exit Triggered
LOW Signal Follow-Up - 10 Days Review: -2.59% Performance Executive Summary A trendchange signal ...
Aug 21, 2026HD Signal Follow-Up: -1.49% at 10 Days, Exit Triggered
HD Signal Follow-Up - 10 Days Review: -1.49% Performance Executive Summary On August 06, 2026, a ...
Aug 20, 2026