
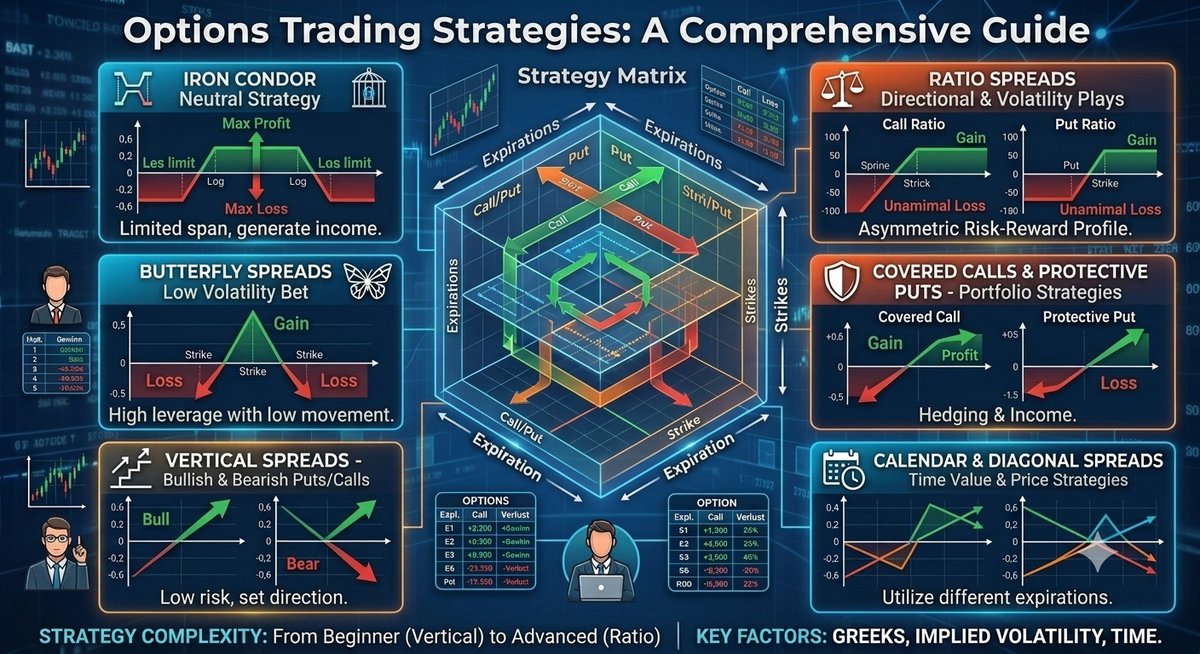
This page is the starting point for every options strategy guide on StockBotty. Before diving into individual strategies, it’s worth being solid on the fundamentals – what an options contract actually is, how it’s structured, what you can trade it on, and the risk measures (“the Greeks”) used to describe how its price behaves. Once that’s covered, every guide linked below builds directly on these building blocks.
Explore the Strategy Guides
Each guide below covers the structure, payoff profile, Greeks, and risks of a specific strategy in depth, including risks that go beyond the standard introductory explanation.
How Options Actually Work
Beyond individual strategies, a few mechanics topics come up across almost every guide on this site – assignment, rolling, implied volatility, and how to actually read what a broker’s option chain is showing. Each one gets its own dedicated, in-depth page rather than a paragraph repeated in every strategy guide it touches.
What Is an Options Contract?
An option is a contract between a buyer and a seller. The buyer pays a premium up front for the right – but not the obligation – to buy or sell a specific underlying asset at a fixed price (the strike price) on or before a set expiration date. The seller collects that premium and takes on the matching obligation if the buyer chooses to exercise.
There are two basic types:
- Call options give the buyer the right to buy the underlying at the strike price. Calls increase in value as the underlying rises.
- Put options give the buyer the right to sell the underlying at the strike price. Puts increase in value as the underlying falls.
In US equity and ETF options, one contract typically represents 100 shares of the underlying, so a premium quoted as $1.50 per share costs $150 per contract.
American vs. European Style Options
“American” and “European” describe when an option can be exercised – not where it’s traded. This distinction shows up throughout the risk sections of the strategy guides on this site, so it’s worth understanding early:
- American-style options can be exercised at any point before expiration. Most single-stock and ETF options in the US are American-style, which is why early assignment is a real, recurring risk for short option positions.
- European-style options can only be exercised at expiration itself. Most broad-based index options (like SPX or XSP) are European-style and are also typically cash-settled rather than resulting in stock delivery – this removes early assignment risk entirely, which is one reason some traders prefer index options for multi-leg strategies.
What Can You Trade Options On?
- Individual stocks – the most common underlying for retail traders, with options available on most actively traded, listed companies.
- ETFs – options on exchange-traded funds behave like stock options but offer exposure to a basket of holdings, a sector, or a broad index in one position.
- Stock indexes – options directly on an index (rather than an ETF tracking it) are typically European-style and cash-settled, with no underlying shares changing hands.
- Futures – options on futures contracts extend into commodities, currencies, and interest rate products, but generally require a separate futures-approved brokerage account rather than a standard equity options account.
Where Options Are Traded
Listed options trade on regulated exchanges – in the US, that includes Cboe (the largest options exchange and the original home of listed options trading), along with Nasdaq, NYSE Arca, and several others. These exchanges match buy and sell orders and handle clearing through the Options Clearing Corporation, which guarantees contract performance on both sides of every trade.
Retail access to that market goes through a brokerage account approved for options trading – brokers typically require a separate application and assign an approval level based on experience and account size, since some strategies (like uncovered short options) carry meaningfully more risk than others. The broker routes orders to the exchange and provides the account infrastructure, market data, and order execution; the exchange itself is where the trade is actually matched and cleared.
The Greeks: First-Order Risk Measures
The Greeks are a set of risk measures that describe how an option’s price responds to different underlying factors. Every strategy guide on this site references them, since they explain why a position behaves the way it does as the stock moves, time passes, and volatility changes.
| Greek | Measures sensitivity to | In practice |
|---|---|---|
| Delta | A $1 move in the underlying | Roughly how much the option’s price moves per $1 move in the stock; also a rough proxy for the probability of finishing in the money. |
| Theta | The passage of time | How much value an option loses per day, all else equal – the mechanism behind every time-decay-based strategy covered in this series. |
| Vega | A change in implied volatility | How much the option’s price changes for a given change in IV – the reason some strategies benefit from rising volatility and others from falling volatility. |
| Gamma | The rate of change of Delta itself | How quickly Delta shifts as the stock moves – the source of the “gamma risk near expiration” warning that appears throughout this series. |
| Rho | A change in interest rates | Usually the least impactful Greek for short-dated retail strategies, but more relevant for longer-dated options. |
The Greeks: Second-Order Risk Measures
Beyond the primary Greeks, a set of second-order Greeks describe how those primary sensitivities themselves change – essentially, Greeks of Greeks. These matter most for market makers and larger portfolios managing many positions at once, but a few show up indirectly in retail-facing tools, including the GEX (gamma exposure) and flip-strike concepts used elsewhere on this site.
- Vanna – how much Delta changes as implied volatility changes. Large aggregate vanna exposure among options dealers is one driver of the price moves seen around volatility events.
- Charm – how much Delta changes purely from the passage of time. This is part of why a position’s directional exposure can drift even when the stock hasn’t moved.
- Vomma (Volga) – how much Vega changes as implied volatility changes, relevant for positions with significant volatility exposure.
- Veta – how much Vega changes as time passes.
- Speed – how much Gamma changes for a given move in the underlying.
- Zomma – how much Gamma changes as implied volatility changes.
- Color – how much Gamma changes purely from the passage of time.
- Ultima – how much Vomma changes as implied volatility changes, a third-order measure included here for completeness.
Most individual traders never calculate these directly – they matter more for understanding why the market itself sometimes behaves the way it does (for example, around large option expirations) than for managing an individual retail position day to day.
📖 Want the full picture? This overview keeps the Greeks brief on purpose. For a deeper look – including why Delta’s “probability” interpretation isn’t quite exact, why theta decay curves differ for at-the-money, in-the-money, and out-of-the-money options, and how a single IV spike cascades through Delta, Gamma, and Vega at once via Vanna, Vomma, and Zomma – see the dedicated Options Greeks Explained guide.
Options Flow and Dealer Positioning
Beyond the Greeks of an individual option, a set of aggregate metrics describe how the options market as a whole is positioned – and, in particular, how the dealers on the other side of most retail trades are likely to behave. These are the metrics used throughout StockBotty’s scanner and symbol pages (GEX, the GEX flip, PCR, IV-Rank, and their Z-scores), so it’s worth understanding what each one actually measures.
Gamma Exposure (GEX) and Dealer Positioning
When a retail trader buys an option, someone on the other side – typically a market maker – sells it. To stay roughly market-neutral, that market maker hedges by buying or selling the underlying stock, and how much stock they need to buy or sell as the price moves is governed by gamma. Gamma Exposure (GEX) aggregates the gamma of all outstanding options on a symbol, weighted by open interest, into a single number that estimates the net hedging pressure dealers are exposed to at the current price.
- Positive GEX means dealers are, in aggregate, long gamma. As the stock rises, they need to sell stock to stay hedged; as it falls, they need to buy. This creates a stabilizing effect – dealer hedging leans against the move, which tends to suppress volatility and keep price contained in a range.
- Negative GEX means dealers are net short gamma. Their hedging now works the other way: they sell into declines and buy into rallies, which reinforces the move rather than dampening it. Negative GEX environments are associated with larger, faster moves in both directions.
This is why GEX shows up throughout the strategy guides on this site – a premium-selling strategy like an iron condor benefits from the stability positive GEX tends to produce, while a large move that some ratio spreads or long options are positioned for is more likely when GEX is negative.
The GEX Flip (Gamma Flip)
Since GEX is calculated at every strike, it isn’t a single fixed number for a stock – it changes as the price itself moves, because different strikes come into or out of relevance. The GEX flip (also called the gamma flip) is the price level at which aggregate dealer gamma exposure crosses from positive to negative, or vice versa.
This level matters because it marks a potential regime change. Above the flip, dealer hedging might be stabilizing; below it, the same stock’s hedging flows can start amplifying moves instead. A stock trading close to its GEX flip is sitting near a boundary where its own volatility character can shift – which is part of why the flip strike’s distance from the current price is highlighted as its own metric on StockBotty’s options pages, and why crossing it is treated as a meaningful event rather than just another price level.
Z-Scores: Measuring How Unusual a Reading Is
A raw number like “GEX is 450” or “the Put/Call Ratio is 1.3” is hard to interpret on its own – is that high, low, or normal for this particular stock? A Z-score answers that by expressing how many standard deviations a current reading is from its own recent average. A Z-score of 0 means the reading is exactly at its typical level; a Z-score of +2 means it’s two standard deviations above where it normally sits – a statistically unusual reading in the direction that matters, regardless of what the raw units are.
Using Z-scores instead of raw values lets metrics with very different scales – GEX (in the millions), PCR (a ratio around 1.0), IV-Rank (a percentage) – all be compared on the same “how extreme is this right now” basis, and lets the same threshold logic apply consistently across many different symbols with very different typical GEX or volume levels.
GEX Z-Score
Applying that same idea to gamma exposure, a GEX Z-score compares the current GEX reading against its own recent historical distribution for that specific symbol, rather than looking at the raw GEX number in isolation. A large positive or negative GEX Z-score signals that dealer positioning is unusually stretched relative to where it normally sits for that stock – which is often more informative than the raw GEX figure alone, since what counts as “high” GEX varies enormously between a mega-cap index ETF and a smaller single stock.
Put/Call Ratio (PCR) and PCR Z-Score
The Put/Call Ratio compares the volume (or open interest) of put options traded against call options traded on a given symbol. A PCR above 1.0 means more puts are trading than calls; below 1.0 means the opposite. On its own, PCR is a rough sentiment gauge – but it’s direction-aware rather than simply “high PCR is bearish”: a PCR reading is generally interpreted relative to confirmation thresholds, since put buying can reflect either bearish speculation or hedging of existing long positions, and the context (alongside GEX and flow bias) matters as much as the raw ratio.
As with GEX, the raw PCR number is less useful than knowing whether it’s unusual for that stock right now – which is what the PCR Z-score (Z-PCR) measures: how many standard deviations the current PCR is from its own 30-day average. A Z-PCR reading far from zero (in either direction) flags a put/call skew that’s statistically extreme relative to that stock’s normal options activity, rather than just “elevated” in absolute terms – often a more reliable signal that something in positioning has genuinely shifted.
IV-Rank
IV-Rank places a stock’s current implied volatility within the context of its own 52-week range, expressed as a percentage from 0 to 100. An IV-Rank of 80% means current IV is higher than it’s been for 80% of the past year – near the top of its own historical range – while an IV-Rank of 20% means IV is historically cheap for that stock right now.
This matters because implied volatility levels vary enormously between stocks – a 40% IV might be unusually high for a stable blue chip and unusually low for a speculative small-cap. IV-Rank normalizes for that by asking “high or low relative to this stock’s own history” rather than comparing raw IV numbers across completely different names. It’s one of the most repeated inputs across the strategy guides on this site: high IV-Rank generally favors premium-selling strategies (short options, iron condors, credit spreads), since options are historically rich; low IV-Rank generally favors premium-buying strategies (long calls, long puts, calendar spreads), since options are historically cheap.
IV-Rank vs. IV Percentile – a Distinction Worth Knowing
IV-Rank and IV Percentile are often used interchangeably, but they measure slightly different things and can disagree.
- IV-Rank looks only at the high and low of the past 52 weeks and asks where current IV sits within that range. It’s a position-within-the-range measurement.
- IV Percentile looks at every trading day in the past year and asks what percentage of those days had a lower IV than today. It’s a position-within-the-distribution measurement.
The difference matters most for a stock that had one brief, extreme volatility spike – a single earnings gap or news event – sometime in the past year. That one outlier day can stretch the 52-week high used by IV-Rank, which can make current IV look artificially low in rank terms even if it has actually been elevated on most days. IV Percentile is less distorted by a single extreme reading, since it weighs the whole distribution of days rather than just the two endpoints. Neither measure is strictly “more correct” – but when the two disagree meaningfully for the same stock, it’s usually a sign that its volatility history includes at least one sharp outlier worth being aware of.
Worked Example: Losing Money on a Short Put Without the Stock Moving
Implied volatility isn’t just a number that decides how much premium is available up front – it keeps moving after the trade is on, and that alone can produce real, unrealized losses. Stock trading at $100, IV-Rank sitting low. A trader sells the 95-strike put, 45 days out, for $1.20 ($120 collected), reasoning that cheap premium still beats no premium.
A week later, the stock is still exactly at $100 – no price movement at all – but implied volatility has jumped sharply on broader market nerves. The same 95-strike put, unchanged in every way except the IV input, is now priced at $2.60. The position shows a $140 unrealized loss, entirely from the IV expansion, with the stock not having moved a cent.
This is the practical, felt version of vega risk described in the Greeks deep-dive – and it’s also the direct argument for paying attention to IV-Rank before selling: entering the same trade when IV-Rank was already high leaves less room for IV to expand further against the position, and more room for it to contract in the seller’s favor instead.
⚡ A practical sizing note: during stretches where implied volatility is low across the board – not just for one stock, but broadly – some traders deliberately reduce how much of their book is deployed, running at something like 50-75% utilization rather than fully allocated, specifically to keep a buffer available for a broad IV expansion or a market pullback rather than being caught fully sized right as premium selling gets less favorable.
Frequently Asked Questions
What is an options contract?
A contract that gives the buyer the right, but not the obligation, to buy or sell an underlying asset at a fixed strike price by a set expiration date. The buyer pays a premium for that right; the seller collects the premium and takes on the corresponding obligation.
What’s the difference between American and European options?
The difference is about timing, not location. American-style options can be exercised any time up to expiration. European-style options can only be exercised at expiration itself. In the US, most single-stock options are American-style, while most broad index options are European-style.
What can you trade options on?
Individual stocks, ETFs, and stock indexes are the most common underlyings for retail traders. Options also exist on futures contracts covering commodities, currencies, and interest rates, though these typically require a different account setup than stock and ETF options.
Where are options traded?
On regulated options exchanges such as Cboe, Nasdaq, and NYSE Arca, accessed through a brokerage account approved for options trading. The exchange matches and clears the trade; the broker provides the account, order routing, and market data.
What are the Greeks in options trading?
A set of risk measures describing how an option’s price responds to different factors. The primary Greeks are Delta (price), Theta (time), Vega (volatility), Gamma (the rate of change of Delta), and Rho (interest rates). Second-order Greeks, such as Vanna and Charm, describe how those primary Greeks themselves change.
What is Gamma Exposure (GEX)?
GEX aggregates the gamma of all outstanding options on a symbol into a single estimate of dealer hedging pressure. Positive GEX means dealer hedging tends to stabilize price and suppress volatility; negative GEX means dealer hedging tends to amplify moves in either direction.
What is the GEX flip (gamma flip)?
The GEX flip is the price level at which aggregate dealer gamma exposure crosses from positive to negative, or vice versa. Crossing this level can mark a shift from a stabilizing volatility regime to an amplifying one, or the reverse.
What is IV-Rank?
IV-Rank places a stock’s current implied volatility within its own 52-week range, expressed as a percentage from 0 to 100. A high IV-Rank means options are historically expensive for that stock right now; a low IV-Rank means they’re historically cheap.
What is the difference between IV-Rank and IV Percentile?
IV-Rank looks only at the 52-week high and low and asks where current IV sits within that range. IV Percentile looks at every trading day in the past year and asks what percentage had a lower IV than today. A single extreme volatility spike can distort IV-Rank more than IV Percentile, since Rank only anchors to the two endpoints of the range.
What is a Z-score in options trading?
A Z-score expresses how many standard deviations a current reading, such as GEX or the Put/Call Ratio, is from its own recent historical average for that symbol. It normalizes very different metrics onto the same “how unusual is this right now” scale.