
WMT: Historical Data Shows 7.93% Edge – Here’s the Trade Setup
Executive Summary
WMT (Walmart Inc.) is flashing a compelling 7.93% historical edge based on our trend change signal analysis. This Consumer Defensive giant has demonstrated measurable performance patterns when entering this particular price range, with the strongest follow-through appearing in the 60-day window at 21.73%. The data reveals a clear dichotomy: certain entry ranges reward patience while others demand quick exits. Understanding where price lands on Day 10 becomes the critical decision point for managing this trade.
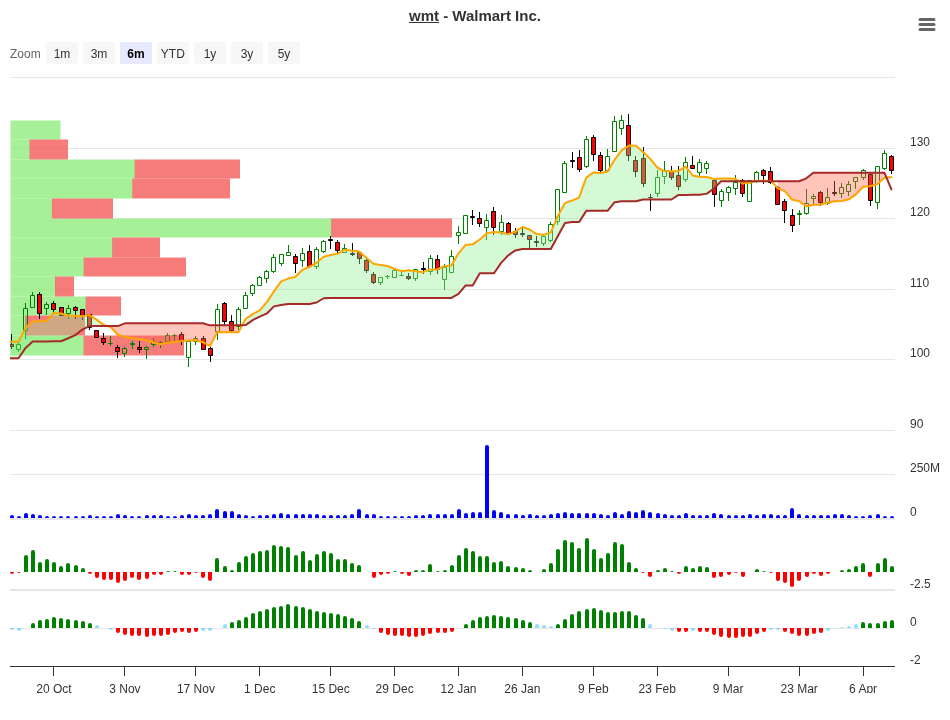
WMT Trend Change Signal Analysis – 2026-04-10
Signal Analysis: Breaking Down the Historical Pattern
WMT’s current 7.93% edge places it in an interesting middle ground within our signal framework. Let’s examine what the historical backtests reveal across different price ranges and timeframes.
| Price Range | Sample Size | 10-Day Return | 20-Day Return | 30-Day Return | 60-Day Return | Signal |
|---|---|---|---|---|---|---|
| 7-10% | 1 | +8.54% | +2.60% | +2.60% | +3.20% | Close |
| 5-7% | 1 | +5.70% | +4.30% | +4.00% | +21.73% | Hold |
| 3-5% | 8 | +3.55% | +4.10% | +6.00% | +10.00% | Hold |
| 1-3% | 9 | +2.06% | +2.90% | +5.10% | +12.30% | Hold |
| 0-1% | 2 | +0.64% | -3.40% | -3.40% | +4.20% | Close |
| -1-0% | 3 | -0.42% | +2.90% | +4.40% | +14.90% | Neg |
| -3-1% | 6 | -1.97% | -1.00% | -0.00% | +3.90% | Neg |
| -5-3% | 1 | -4.45% | +10.80% | +3.50% | +9.90% | Neg |
What stands out immediately? Price ranges that stay near breakeven (0-1% and -1-0%) carry a “Close” or “Neg” signal. These regions lack conviction and can quickly deteriorate into losses on the 20-30 day horizon. The sweet spot emerges in the 1-3% and 3-5% ranges, where the data is both plentiful (8-9 occurrences) and consistent, showing steady gains across all timeframes.
Peak Performance by Timeframe
Understanding which holding period offers the best historical returns helps inform your profit-taking strategy.
| Timeframe | Best Return | Range |
|---|---|---|
| 10 Days | +8.54% | 7-10% range |
| 20 Days | +10.78% | -5-3% range |
| 30 Days | +5.99% | 3-5% range |
| 60 Days | +21.73% | 5-7% range |
The 60-day picture is particularly interesting. Positions entered in the 5-7% range historically delivered 21.73% gains after two months. That’s significantly better than the 20-day peak. This suggests patience can be rewarded, but only if you’re in the right range to begin with.
What to Do on Day 10?
The 10th trading day is your critical fork in the road. Where price sits relative to your entry determines whether to hold, accumulate, or close. This decision guide is based entirely on the historical data above.
| 10-Day Position | Historical Best Timeframe | Recommended Action | Reason |
|---|---|---|---|
| +7% to +10% | 20-30 days (gains fade) | Take Profits / Close | Strong 10-day move but momentum historically cools; 20-day return of +2.60% suggests diminishing returns ahead. |
| +5% to +7% | 60 days (+21.73%) | Hold & Add | Best risk/reward profile. Only 1 sample but exceptional 60-day upside. Medium 10-day return leaves room for acceleration. |
| +3% to +5% | 30-60 days (+6% to +10%) | Hold | Solid foundation with 8 historical cases. Consistent mid-single-digit returns across all timeframes. Low early damage risk. |
| +1% to +3% | 60 days (+12.30%) | Hold | Most frequent occurrence (9 cases). Sluggish 10-day start but excellent long-term rebound to +12.30% by 60 days. Reward patience here. |
| 0% to +1% | 10 days (only gain) | Close Position | Breakeven trades turn negative by day 20 (-3.4%). Exit rule triggers. Avoid chasing recovery. |
Use this framework: if you’re up more than 7% by Day 10, take profits and reduce risk. If you’re in the 1-5% zone, hold longer – the data shows real upside emerges in weeks 3-8. If you’re flat or barely positive, close the trade before losses accelerate into the 20-day window.
Market Context: Why WMT Matters Right Now
Walmart operates in the Consumer Defensive sector, a classification that typically attracts capital during periods of economic uncertainty. The company maintains a market cap of approximately $1.01 trillion, making it one of the largest publicly traded retailers globally. This scale provides both liquidity and resilience.
Looking at the fundamental picture, WMT’s valuation tells a nuanced story. The P/E ratio of 46.44 reflects elevated market expectations for earnings growth. The price-to-free-cash-flow of 95.76 suggests investors are pricing in substantial future cash generation, which is reasonable given the company’s stable business model.
On the profitability side, gross margins of 24.93% and operating margins of 4.57% are typical for large-format discount retailers competing on volume and efficiency rather than margin expansion. What’s impressive is the Return on Equity of 21.85% – this indicates management is deploying shareholder capital effectively despite operating in a notoriously thin-margin industry.
Exit Rules & Risk Management
Clear exit criteria prevent emotional decision-making. Based on the historical data and signal framework, here are your guardrails:
Rule 1: Close if Performance <= 1% After 10 Days – Positions that haven’t gained at least 1% by the 10-day mark show a troubling pattern of deterioration into weeks 2-3. Historical losses ranged from -0.42% to -3.4% in the 20-30 day window for these trades. Why hold a losing position when the data shows better odds elsewhere?
Rule 2: Maximum Stop-Loss at -10% – Even with a favorable long-term thesis, letting a single position decline more than -10% ties up capital that could be deployed in higher-probability setups. This is your absolute line in the sand.
Rule 3: Take Partial Profits in the +7-10% Range – The data shows the sharpest gains arrive in the first 10 days when price moves into this zone. Historical follow-through (20-30 days) is marginal. De-risk by taking 30-50% of your position off the table, letting runners stay invested for longer-term upside.
Risk management is about matching position size to edge. A 7.93% edge suggests a unit size that can absorb the occasional -10% loss without damaging your overall account. Position sizing is just as important as entry timing.
Conclusion
WMT’s 7.93% historical edge reflects a measurable pattern where certain entry ranges deliver consistent returns across multiple timeframes. The data isn’t a guarantee – it’s a probability map. Your job is to execute on what the statistics favor: hold the middle ranges (1-5% gains on Day 10), take profits in early winners, and exit trades that stall near breakeven.
The most striking finding is the divergence between early momentum and long-term returns. A trade up +7-10% in 10 days might look like an obvious winner, but the historical pattern suggests patience in the 1-5% zone is rewarded more handsomely by Day 60. This is counterintuitive, which is precisely why backtested data matters – it helps you fight the urge to chase early winners at the expense of higher-probability longer-term positions.
Always remember: edge exists at the aggregate level. Individual trades will deviate. Your discipline in following the exit rules and letting winning positions run in the right price ranges is what converts statistical edge into actual profits.
For more analysis visit stockbotty.com | Disclaimer: stockbotty.com/disclaimer
More Stocks - Signals Articles
FSLR Signal Follow-Up 10 Days: -10.47% Stoploss Exit
FSLR Signal Follow-Up - 10 Days Review: -10.47% Performance Executive Summary A trendchange signa...
Aug 22, 2026LLY Signal Follow-Up – 10 Days: +1.90% Performance Review
LLY Signal Follow-Up - 10 Days Review: +1.90% Performance Executive Summary The LLY trendchange s...
Aug 22, 2026NFLX Signal Follow-Up +4.33% – 10 Days Review & Hold Decision
NFLX Signal Follow-Up - 10 Days Review: +4.33% Performance Executive Summary On August 10, 2026, ...
Aug 22, 2026LOW Signal Follow-Up: -2.59% After 10 Days, Exit Triggered
LOW Signal Follow-Up - 10 Days Review: -2.59% Performance Executive Summary A trendchange signal ...
Aug 21, 2026HD Signal Follow-Up: -1.49% at 10 Days, Exit Triggered
HD Signal Follow-Up - 10 Days Review: -1.49% Performance Executive Summary On August 06, 2026, a ...
Aug 20, 2026