
TMUS Stock Trend Change Signal: T-Mobile Shows 11.68% Edge with Mixed Technical Setup
Executive Summary
T-Mobile US, Inc. (TMUS) displays an 11.68% historical edge in its quantitative signal pattern, indicating potential upside momentum in certain market conditions. Trading at $217.26, the stock sits above its 50-day moving average (+6.33%) but below its 200-day average (-2.19%), creating a mixed technical backdrop. With 25 analyst ratings averaging a “Buy” consensus and a median price target of $270, TMUS offers compelling value for momentum-focused traders, though the leveraged balance sheet (208.85% debt-to-equity) demands disciplined risk management. The company’s 11.3% quarterly revenue growth and 1.9% forward dividend yield provide fundamental support alongside technical signals.
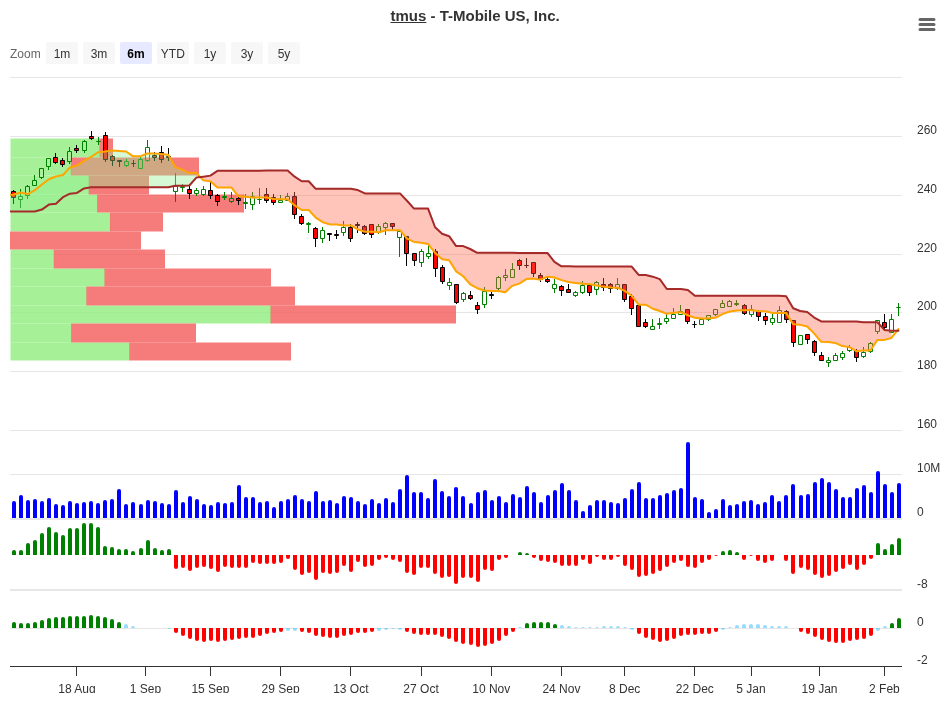
TMUS Trend Change Signal Analysis – 2026-02-04
Signal Analysis: Understanding the 11.68% Edge
The StockBotty quantitative edge system analyzes historical price ranges following specific trading signals to identify patterns with statistical advantage. For TMUS, the analysis shows how different entry price ranges have performed over 10, 20, 30, and 60-day periods. Here is the complete signal distribution:
| Price Range | Count | 10-Day Avg | 20-Day Avg | 30-Day Avg | 60-Day Avg | Signal |
|---|---|---|---|---|---|---|
| +10-15% | 1 | +13.74% | +14.60% | +9.30% | +1.90% | Close |
| +5-7% | 2 | +5.60% | +5.70% | +6.60% | +6.90% | Hold |
| +3-5% | 2 | +4.37% | +4.00% | +15.10% | +21.00% | Hold |
| +1-3% | 3 | +2.00% | -1.00% | +0.60% | +0.50% | Close |
| 0-1% | 5 | +0.27% | +0.30% | -0.10% | +3.40% | Close |
| -1-0% | 9 | -0.66% | -1.40% | +0.10% | +12.00% | Neg |
| -3-1% | 5 | -1.77% | +0.60% | +0.00% | +9.10% | Neg |
| -5-3% | 4 | -3.86% | +0.80% | -0.80% | -2.10% | Neg |
| -7-5% | 3 | -5.70% | -3.50% | -2.50% | -2.40% | Neg |
| -10-7% | 1 | -8.08% | -8.60% | -8.30% | +0.00% | Neg |
The signal data reveals a clear dichotomy: trades initiated at +3% to +7% (moderate upside), signal “Hold” with consistent positive follow-through across all timeframes. The best 60-day performance of +21.00% occurred in the +3-5% range, suggesting patience is rewarded in moderately bullish setups. Conversely, trades at +10-15% signal “Close,” indicating profit-taking into strong rallies. Negative price movements consistently signal “Neg,” with further downside risk across multiple timeframes.
Peak Performance Analysis
Historical backtests show the strongest average returns occur in specific timeframes:
| Timeframe | Highest Avg Gain | Price Range | Sample Size (n) |
|---|---|---|---|
| 10 Days | +13.74% | +10-15% | 1 |
| 20 Days | +14.59% | +10-15% | 1 |
| 30 Days | +15.09% | +3-5% | 2 |
| 60 Days | +21.04% | +3-5% | 2 |
What to Do on Day 10? – Decision Guide
After 10 trading days, your TMUS position will occupy one of several price ranges relative to entry. Here is a practical guide based on historical backtests showing which ranges had the best follow-through and where to take profits:
| 10-Day Position | Historical Best Timeframe | Recommended Action | Reason |
|---|---|---|---|
| +10-15% | 20-30 days: +14.6% to +9.3% | Close Position / Take Profits | Strong early move often signals reversal risk. Exit rules recommend closing at this level. Lock in gains before momentum fades. |
| +5-7% | 60 days: +6.9% (consistent) | Hold Position | Solid steady gains across all timeframes. Risk is balanced. Continue holding for 60-day target of +6-7% minimum. |
| +3-5% | 60 days: +21.0% (strongest) | Hold / Add on Dips | This range showed the highest 60-day returns (+21%). Historical pattern suggests patience is rewarded. Moderately bullish setup with strongest tail-end upside. |
| +1-3% | 60 days: +0.5% (weak) | Consider Exit or Tighten Stop | Exit rules target this level. Minimal follow-through on 20-day (-1.0%). Exit recommended; if holding, set stop loss at entry. |
| 0-1% or Below | Flat to negative medium-term | Exit / Apply Stop Loss | Exit rules clearly state close at <=3% after 10 days. Apply 10% maximum stop loss. Capital preservation is priority. |
How to Use This Guide: On Day 10, measure your TMUS position against entry price and identify which range applies. The table shows what history suggests happened after: positions entering at +3-5% historically extended to +21% by day 60, while positions at +10-15% typically retraced. Use the “Reason” column to understand whether your current situation fits the historical pattern. Always apply the hard exit rule if you fall into the +1-3% or lower categories after 10 days. Position sizing and risk discipline matter more than being “right” on direction.
Technical Analysis
TMUS exhibits a mixed technical backdrop at $217.26, trading 6.33% above its 50-day exponential moving average ($204.33) but 2.19% below its 200-day simple moving average ($222.14). This positioning between the two key moving averages often represents a consolidation zone where directional bias is uncertain. The stock is currently at the 39.4% position within its 52-week range, closer to the midpoint than recent extremes. Over the past 52 weeks, TMUS has ranged from $181.36 (low) to $272.60 (high), with the current price representing a 19.80% rally from the 52-week low but 20.30% below the 52-week high. The stock remains 21.42% away from its all-time high of $276.49, suggesting upside room exists if momentum accelerates. Recent volume trends show average daily volume of 6.04 million shares, with 10-day average volume at 4.67 million shares, indicating moderately active trading but below the typical 3-month average, which may indicate consolidation ahead of a directional move. The proximity to the 50-day moving average, combined with the stock’s slight underperformance versus its 200-day, creates a scenario where a close above $222 could signal renewed upside momentum, while a breakdown below $204 would indicate downside risk.
Fundamental Analysis
T-Mobile’s operational fundamentals support an investment case centered on growing market share and operational leverage. The company generated 11.3% quarterly revenue growth to $88.3 billion in trailing twelve months, with revenue per share of $78.29 demonstrating strong top-line expansion in a mature telecom market. Gross margins stand at 63.17%, indicating pricing power and efficient operations, while operating margins of 18.37% show disciplined cost control. The net profit margin of 12.45% is respectable for telecom infrastructure, resulting in net income of $11.0 billion. However, the earnings growth picture is less encouraging with quarterly earnings declining 29.5%, suggesting near-term earnings headwinds despite revenue expansion. Return on equity of 18.18% demonstrates effective capital deployment, though this is tempered by the company’s leverage structure. The company’s weighted average cost of capital is impacted by a highly leveraged balance sheet, which limits financial flexibility.
Valuation Metrics
| Metric | Value | Assessment |
|---|---|---|
| Trailing P/E | 22.38x | Slightly elevated vs. telecom peers; growth not yet justifying premium |
| Forward P/E | 15.46x | More attractive, implying earnings recovery expected |
| Price-to-Sales | 2.75x | In line with large-cap telecom operators |
| Price-to-Book | 4.06x | Premium to asset base reflects 18.2% ROE and market positioning |
| EV/Revenue | 4.02x | Reflects substantial debt in enterprise value |
| EV/EBITDA | 10.81x | Mid-range for telecom; reasonable given growth profile |
| Price-to-FCF | 30.39x | High; indicates limited FCF relative to market cap; debt servicing is substantial |
| Market Cap | $243.0B | Third-largest US carrier by market value; substantial scale |
The valuation picture is mixed. The forward P/E of 15.46x is attractive relative to the trailing 22.38x, suggesting the market expects earnings stabilization or improvement. However, the price-to-FCF multiple of 30.39x is concerning given that levered free cash flow was only $8.0 billion against a $243 billion market cap. This indicates that dividend payments (4.08% annual) and debt servicing consume a substantial portion of operating cash generation, leaving limited flexibility for growth investments or shareholder returns without refinancing risk. The stock is trading $52 below the analyst median price target of $270, implying 24% upside to consensus, though 25 analysts showing a median target of $270 and high of $310 suggests institutional confidence in a recovery scenario.
Analyst Consensus
| Metric | Value |
|---|---|
| Number of Analysts | 25 |
| Average Rating | 1.83 = Buy |
| Median Target Price | $270.00 |
| Mean Target Price | $268.52 |
| Target High | $310.00 |
| Target Low | $220.00 |
| Upside to Median | +24.3% |
| Downside Risk (vs. Low) | -1.2% |
Wall Street consensus is firmly bullish with 25 analysts averaging a 1.83 rating (1=Buy, 2=Hold, 3=Sell). The median price target of $270 implies 24.3% upside from the current $217.26 price, with analyst targets ranging from a low of $220 to a high of $310. This wide range reflects divergent views on competitive dynamics and financial leverage. The downside risk to the low target is minimal at 1.2%, suggesting limited consensus for a significant correction. The consensus view aligns with TMUS’s position as a market-share gainer in US wireless, though debt reduction remains a key catalyst for upside scenarios.
Dividend and Income Profile
T-Mobile offers a modest but growing dividend yield, providing income support to the equity. The forward annual dividend is $4.08 per share, equating to a 1.88% forward yield based on the current price. An upcoming ex-dividend date is February 20, 2026, with dividend payment expected in March 2026. The current payout ratio of 37.65% is conservative for telecom, leaving room for dividend growth without straining balance sheet capacity. Annualized, shareholders receive $4.08 in dividends, positioning TMUS as a total-return play rather than a pure income vehicle. The stock’s recent dividend of $1.02 indicates quarterly payments of approximately $1.02 per quarter. For income-focused investors, the 1.88% yield is below the broader market average and below many dividend-focused telecom peers, but it provides a hedge against downside volatility for longer-term holders. The combination of 1.88% yield plus potential 11.68% edge-based momentum creates a compelling risk/reward for traders seeking both current income and upside leverage.
Risk Factors and Concerns
Leverage Risk: The most pressing concern for TMUS is its leverage structure. Total debt of $123.6 billion against a market cap of $243 billion creates a debt-to-equity ratio of 208.85%, one of the highest in large-cap US equities. Net debt of $118 billion (after $5.6 billion in cash) represents 3.6x trailing EBITDA, limiting financial flexibility. Interest rate volatility directly impacts debt servicing costs. Rising rates could compress margins and reduce free cash flow available for dividends or buybacks.
Earnings Headwinds: Quarterly earnings declined 29.5% despite 11.3% revenue growth, indicating margin compression or one-time charges. This earnings deceleration raises questions about sustainable profitability growth and suggests near-term headwinds from competitive pricing pressure, increased device promotion costs, or higher operating expenses.
Competitive Intensity: The US wireless market remains intensely competitive, with Verizon, AT&T, and TMUS competing aggressively on price and network quality. Sustained competitive pressure could limit pricing power and margin expansion, though TMUS’s market-share gains suggest it is winning in this environment.
Regulatory Risk: Telecom is a heavily regulated industry. Changes in spectrum auctions, merger regulations, or net neutrality rules could impact profitability and strategic optionality. Federal legislation or executive actions could impose new compliance costs or operational constraints.
Economic Sensitivity: While telecom is relatively defensive, consumer spending slowdowns could reduce device upgrades and service demand. A recession could accelerate churn to lower-cost prepaid offerings, pressuring margins. The company’s exposure to Metro by T-Mobile (value brand) provides some mitigation but also lower-margin exposure.
Signal Limitations: The 11.68% edge is a historical statistical pattern, not a guarantee of future returns. Market regimes shift, and past performance does not indicate future results. The signal is based on a limited sample size for some price ranges (e.g., only 1 observation for +10-15% and -10-7%), increasing variability risk.
Exit Rules and Risk Management
The quantitative system defines disciplined exit criteria to protect capital:
Primary Exit Rule: Close position if performance is less than or equal to 3% after 10 trading days. This hard rule prevents money from sitting in weak positions, freeing capital for higher-conviction setups. Traders using this system must enforce this rule mechanically, without exception.
Stop Loss: Set a maximum stop loss of -10% from entry. This protective stop prevents catastrophic losses in the event of a negative signal or unexpected adverse event. For a trader entering at $217.26, the stop loss would be placed at $195.53.
Historical Loss Profile: Historical backtests on positions that triggered the close rule or hit the 10% stop loss resulted in average losses between -0.66% and -10%. This underscores the importance of disciplined exits; allowing positions to run against you beyond the system parameters historically resulted in significant losses.
Position Sizing: Risk no more than 1-2% of account capital per TMUS trade. Given the 208.85% debt-to-equity ratio and earnings volatility, position concentration risk is elevated. Smaller position sizes offset the elevated fundamental risk.
Profit Taking: For positions in the +10-15% range after 10 days, close immediately and capture profits. Holding into reversals at this level historically failed to deliver incremental upside. For positions in the +5-7% range, consider trailing stops to capture tail-end upside (60-day average +6.9%) while locking in gains.
Conclusion
TMUS presents a nuanced trading and investment opportunity defined by three distinct factors: a statistically significant 11.68% quantitative edge, strong analyst consensus supporting 24% upside to target prices, and a leveraged balance sheet that demands disciplined risk management. The signal analysis reveals that entries in the +3-5% range historically generated the strongest 60-day returns of +21%, while entries at +10-15% consistently triggered profit-taking signals. The stock’s mixed technical setup (above GD50, below GD200) provides an inflection point for directional thesis development. For momentum traders, the quantitative signal edge combined with positive analyst revisions suggests a favorable risk/reward, provided the hard exits at <=3% and 10% stop loss are honored. For income investors, the 1.88% yield and conservative payout ratio provide downside support. For fundamental investors, 11.3% revenue growth and 18% return on equity indicate an operationally efficient franchise, though leverage remains a structural headwind. The next pivotal catalyst is the February 11, 2026 earnings announcement, which will clarify whether the recent earnings decline represents a near-term trough or a persistent margin trend. Traders should focus on 10-day position management and the Day 10 decision table; this timeframe discipline is central to the signal methodology.
For more signals visit stockbotty.com | Disclaimer: stockbotty.com/disclaimer
More Stocks - Signals Articles
FSLR Signal Follow-Up 10 Days: -10.47% Stoploss Exit
FSLR Signal Follow-Up - 10 Days Review: -10.47% Performance Executive Summary A trendchange signa...
Aug 22, 2026LLY Signal Follow-Up – 10 Days: +1.90% Performance Review
LLY Signal Follow-Up - 10 Days Review: +1.90% Performance Executive Summary The LLY trendchange s...
Aug 22, 2026NFLX Signal Follow-Up +4.33% – 10 Days Review & Hold Decision
NFLX Signal Follow-Up - 10 Days Review: +4.33% Performance Executive Summary On August 10, 2026, ...
Aug 22, 2026LOW Signal Follow-Up: -2.59% After 10 Days, Exit Triggered
LOW Signal Follow-Up - 10 Days Review: -2.59% Performance Executive Summary A trendchange signal ...
Aug 21, 2026HD Signal Follow-Up: -1.49% at 10 Days, Exit Triggered
HD Signal Follow-Up - 10 Days Review: -1.49% Performance Executive Summary On August 06, 2026, a ...
Aug 20, 2026