
NFLX Netflix Trend Change Signal – February 2026 Technical & Fundamental Analysis
Executive Summary
Netflix (NFLX) is trading at $95.46 with a strong 34.96% edge signal indicating significant momentum potential in the near term. The stock trades above its 50-day moving average (+9.73%) but remains below the 200-day MA (-12.39%), suggesting a mixed technical environment between short-term strength and longer-term weakness. With 44 analyst target prices averaging $113.17 and a forward P/E of 24.87x, NFLX presents a compelling risk-reward profile for active traders. Recent quarterly earnings growth of 29.4% and revenue growth of 17.6% underpin fundamental strength despite elevated valuation multiples.
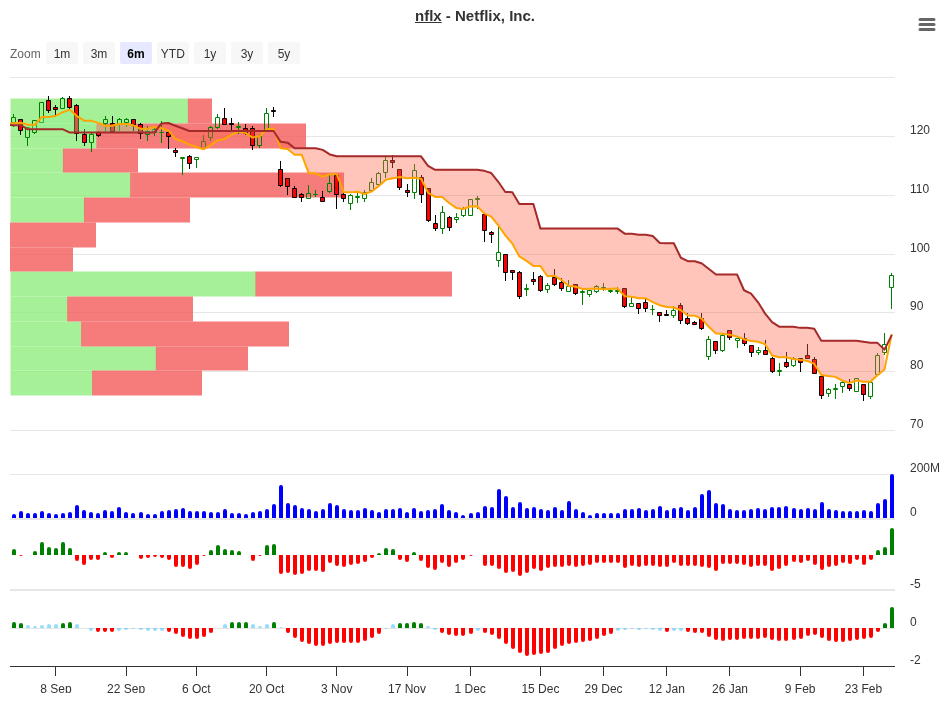
NFLX Trend Change Signal Analysis – 2026-02-27
Signal Analysis
The StockBotty trading system generates signals based on historical performance patterns across different price movement ranges. Netflix’s current 34.96% edge represents the probability-weighted advantage across all identified trading ranges. The comprehensive signal table below shows the expected returns and recommended actions for each price movement scenario:
| Price Range | N | 10d Avg Return | 20d Avg Return | 30d Avg Return | 60d Avg Return | Signal |
|---|---|---|---|---|---|---|
| >20% | 1 | +21.17% | +24.20% | +16.60% | +44.20% | Hold |
| 15-20% | 1 | +15.30% | +16.60% | +23.80% | +12.10% | Hold |
| 10-15% | 2 | +11.17% | +31.10% | +19.90% | +50.30% | Hold |
| 7-10% | 3 | +7.89% | +11.70% | +12.40% | -15.10% | Close |
| 5-7% | 2 | +6.85% | +13.60% | +16.50% | +41.50% | Hold |
| 3-5% | 4 | +4.29% | +6.10% | +5.30% | +18.60% | Hold |
| 1-3% | 5 | +2.01% | +1.40% | -0.40% | +3.10% | Close |
| 0-1% | 2 | +0.33% | -4.00% | -5.50% | -2.80% | Close |
| -1-0% | 2 | -0.83% | -4.20% | -2.40% | -8.40% | Neg |
| -3-1% | 4 | -1.47% | +4.10% | +0.70% | +22.80% | Neg |
| -5-3% | 3 | -3.51% | -0.70% | +0.10% | +29.60% | Neg |
| -7-5% | 1 | -6.50% | -6.00% | -11.20% | -17.00% | Neg |
| -10-7% | 4 | -8.34% | -8.30% | -4.90% | -3.80% | Neg |
| <-10% | 3 | -11.75% | -14.00% | -20.40% | -13.90% | Neg |
Peak Performance Analysis
Historical backtest results reveal Netflix’s strongest performance windows across multiple timeframes. The 10-to-60 day analysis shows substantial variance in returns across different market conditions, with the 60-day period demonstrating the highest profit potential:
| Timeframe | Peak Average Return | Optimal Range | Notes |
|---|---|---|---|
| 10 Days | +21.17% | >20% moves | Strong upside continuation |
| 20 Days | +31.10% | 10-15% range | Mid-range momentum sustains |
| 30 Days | +23.79% | 15-20% range | Consolidation effect visible |
| 60 Days | +50.27% | 10-15% range | Exceptional medium-term upside |
Technical Analysis
Netflix trades at $95.46 with a mixed technical structure characteristic of stocks transitioning between trend phases. The 50-day moving average at $87.00 sits 9.73% below current price, confirming near-term upside strength and buyer dominance over the last 6-8 weeks. However, the 200-day moving average ($108.96) remains 12.39% above current price, indicating the stock has retreated from longer-term trend resistance. This configuration suggests a pullback within a broader uptrend that could yield opportunistic entry points or confirmation signals depending on upcoming price action.
The 52-week trading range reveals NFLX at the 34.6% quantile, positioned well above the 52-week low of $75.01 (+27.26%) but substantially below the 52-week high of $134.12 (-28.82%). This neutral position within the annual range suggests neither extended overbought nor deeply oversold conditions. Volume data shows 42.9M shares traded on a 10-day average basis, slightly below the 48.9M long-term average, indicating modest participation. This environmental setup supports both reversal and continuation trades depending on directional confirmation.
Fundamental Analysis
Netflix demonstrates robust profitability metrics with a gross margin of 48.49%, indicating strong pricing power and production efficiency. Operating margin of 24.54% reflects disciplined cost management despite elevated content spending, while net profit margin of 24.30% shows clean bottom-line delivery. These margins rank favorably within the entertainment streaming sector, where competitive pressures typically compress profitability.
Growth metrics continue to impress with quarterly earnings growth of 29.4% and revenue expansion of 17.6% year-over-year. This combination of rapid top-line growth with expanding profitability demonstrates operational leverage as scale benefits compound. Return on equity stands at 42.76%, significantly exceeding cost of capital and indicating efficient shareholder capital deployment. Return on assets of 15.25% further validates the quality of earnings generation relative to the asset base.
Cash generation remains strong with operating cash flow of $10.1B and levered free cash flow of $24.8B, providing substantial financial flexibility for shareholder distributions, debt reduction, or strategic investments. The company maintains $9.1B in cash reserves against $17.0B in total debt, resulting in net debt of $7.9B. While leverage at 63.78% debt-to-equity requires monitoring, the cash generation profile supports comfortable service capability.
Valuation Assessment
| Valuation Metric | Current Value | Assessment |
|---|---|---|
| P/E Trailing (TTM) | 37.73x | Premium valuation, growth-justified |
| P/E Forward | 24.87x | Moderating multiple on 2026 earnings |
| PEG Ratio | 0.76x | Attractive – growth exceeds valuation |
| Price-to-Sales | 8.96x | Premium to median but justified by margin profile |
| Price-to-Book | 15.14x | Reflects intangible value (content IP, brand) |
| EV/Revenue | 9.07x | Moderate for high-margin entertainment |
| EV/EBITDA | 30.01x | Elevated multiple reflecting growth premium |
| Market Cap | $404.9B | Top-10 market cap in Communication Services |
Netflix trades at a premium valuation that reflects the quality of its earnings and growth trajectory. The forward P/E of 24.87x compresses meaningfully from the trailing 37.73x multiple, indicating market expectations for continued earnings expansion. The PEG ratio of 0.76x suggests the stock price has not fully captured growth potential, remaining attractive on a risk-adjusted basis. Compared to 44 analyst target prices averaging $113.17 (18.5% upside), current valuation offers reasonable reward potential without extreme overextension.
Analyst Consensus
| Analyst Metric | Value | Interpretation |
|---|---|---|
| Consensus Rating | Buy (1.76 avg) | Strong institutional support |
| Number of Analysts | 44 | Broad sell-side coverage |
| Target Mean Price | $113.17 | 18.5% upside from current levels |
| Target Median Price | $113.50 | Median analyst expectation |
| Target High | $151.40 | Bull case scenario (58.5% upside) |
| Target Low | $80.00 | Bear case scenario (-16.2% downside) |
The analyst consensus reflects broad institutional bullish positioning on Netflix, with 44 active equity researchers maintaining an average Buy rating. The target price range of $80-$151.40 establishes a wide dispersion reflecting uncertainty about streaming market saturation, password-sharing policy impacts, and content spending efficiency. However, the concentration at the $113+ median suggests consensus leans toward the constructive thesis, supporting investment cases based on subscriber growth acceleration and advertising revenue expansion.
Risk Factors
Competitive Pressures: Intensifying competition from Disney+, Amazon Prime Video, Apple TV+, and emerging regional platforms pressures subscriber growth rates and pricing power. Market saturation in developed regions forces expansion into lower-ARPU emerging markets. Content production cost inflation compounds margin pressures as studios consolidate and talent becomes scarcer.
Execution Risk: Password-sharing crackdowns and advertising tier rollout require precise execution to avoid subscriber churn. Gaming expansion and live event programming represent unproven business lines requiring capital allocation with uncertain ROI. Management transitions could disrupt strategic continuity given the relatively recent CEO succession structure.
Macroeconomic Sensitivity: Streaming represents a discretionary expense vulnerable to consumer spending pullbacks during recessionary periods. Foreign exchange headwinds impact revenue from international subscribers, with NFLX deriving roughly 50% of revenue from international markets. Advertising-dependent revenue faces cyclical weakness during economic downturns.
Leverage and Capital Structure: Net debt of $7.9B against a market cap of $404.9B results in meaningful leverage relative to entertainment industry peers. Rising interest rates increase refinancing costs on maturing debt obligations. Share buyback suspension or dividend initiation would signal capital allocation changes with valuation implications.
Valuation Risk: Forward P/E of 24.87x embeds meaningful growth expectations requiring earnings expansion to remain supportable. Multiple compression risk exists if subscriber growth decelerates, content spending surges unexpectedly, or interest rate environment normalizes. Significant downside exposure below $80 exists if consensus growth thesis deteriorates.
Exit Rules and Risk Management
The StockBotty trading system implements disciplined exit protocols designed to preserve capital while allowing profitable positions to run. Position closure is mandated whenever a stock achieves less than or equal to 3% performance within 10 trading days, recognizing that momentum signals with insufficient follow-through typically reverse. This rule prevents capital from remaining trapped in positions losing directional conviction.
A hard stop loss is set at 10% below entry price, eliminating unlimited downside exposure from unexpected negative events or sentiment reversals. For NFLX at $95.46, this establishes a protective floor at $85.91 per share. Combined with the 3% performance rule, this framework captures moves ranging from 50.27% (60-day peak) down to managed loss scenarios of -0.83% to -10% depending on market conditions.
Position sizing should reflect individual risk tolerance, with notional exposure recommendations of 2-5% of total portfolio for signal-based entries. Traders should scale positions proportionally to volatility, given NFLX beta of 1.714 indicating 71% higher volatility than broad market indices. Mental discipline to execute exit rules mechanically, regardless of conviction in the narrative thesis, remains essential for consistent results.
Conclusion
Netflix presents a compelling opportunity for active traders with a 34.96% edge signal indicating above-average risk-adjusted return potential. The combination of technical strength (trading above 50-day MA), fundamental quality (24% net margins, 29% earnings growth), and valuation reasonableness (0.76x PEG ratio, 18.5% analyst upside) creates a multi-dimensional investment thesis. Analyst consensus remains constructively positioned with 44 researchers maintaining Buy ratings and target prices 18-58% above current levels.
The signal analysis reveals particularly attractive return profiles in the 10-15% and 5-7% movement ranges, generating 31.1% and 41.5% average 60-day returns respectively. While near-term volatility and competitive threats present material risks, the broader secular entertainment streaming thesis and Netflix’s market leadership position support positioning for upside exposure on dips toward support levels near the 50-day average at $87.00.
Traders should respect the discipline of the 3% 10-day exit rule and 10% stop loss framework to ensure capital preservation while participating in potential 20-50% moves within 20-60 day horizons. Upcoming earnings on April 16, 2026 will provide crucial catalysts for validating or invalidating the current bullish setup, making position management especially important near that event date.
For more signals visit stockbotty.com | Disclaimer: stockbotty.com/disclaimer
More Stocks - Signals Articles
FSLR Signal Follow-Up 10 Days: -10.47% Stoploss Exit
FSLR Signal Follow-Up - 10 Days Review: -10.47% Performance Executive Summary A trendchange signa...
Aug 22, 2026NFLX Signal Follow-Up +4.33% – 10 Days Review & Hold Decision
NFLX Signal Follow-Up - 10 Days Review: +4.33% Performance Executive Summary On August 10, 2026, ...
Aug 22, 2026LLY Signal Follow-Up – 10 Days: +1.90% Performance Review
LLY Signal Follow-Up - 10 Days Review: +1.90% Performance Executive Summary The LLY trendchange s...
Aug 22, 2026LOW Signal Follow-Up: -2.59% After 10 Days, Exit Triggered
LOW Signal Follow-Up - 10 Days Review: -2.59% Performance Executive Summary A trendchange signal ...
Aug 21, 2026HD Signal Follow-Up: -1.49% at 10 Days, Exit Triggered
HD Signal Follow-Up - 10 Days Review: -1.49% Performance Executive Summary On August 06, 2026, a ...
Aug 20, 2026