
INTC Trade Setup: 23% Historical Edge with Clear Exit Rules
Executive Summary
INTC (Intel Corporation) presents a compelling historical trading pattern with a 23.02% edge based on backtested signal analysis. The data reveals that when INTC enters specific price ranges, traders have consistently captured outsized returns-particularly a 27.26% average gain over 10 days in the highest range bracket. However, the setup demands disciplined execution and strict adherence to exit rules, as losses can reach -10% if the trade moves against you. This article breaks down the complete signal structure, performance timelines, and actionable decision rules for traders monitoring INTC.
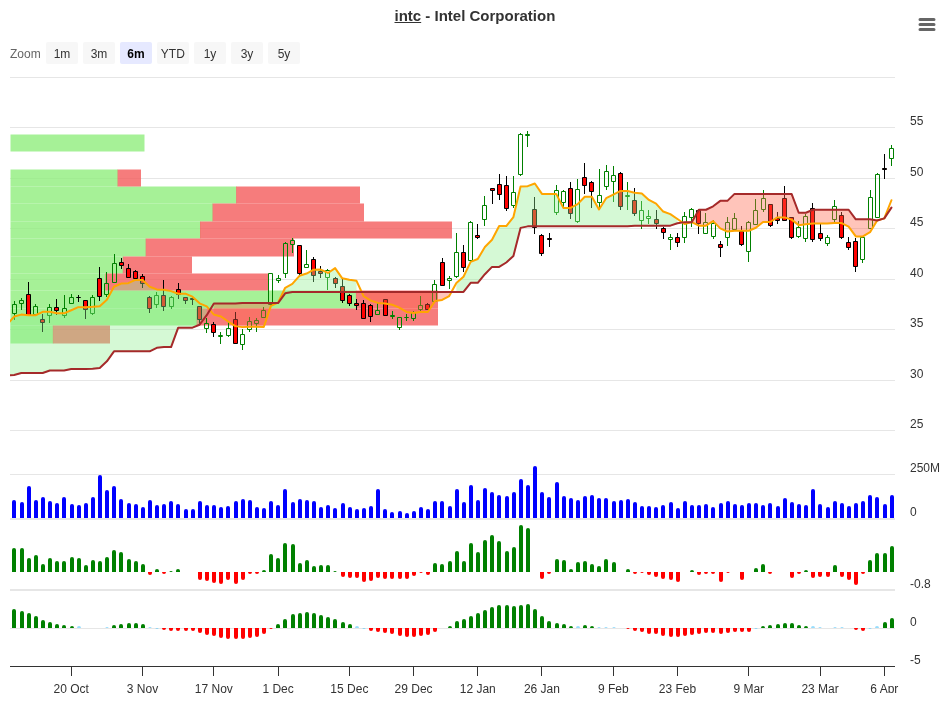
INTC Trend Change Signal Analysis – 2026-04-07
Complete Signal Analysis Table
Understanding the signal table is foundational to executing this strategy. Each row represents a historical price range where INTC was observed, along with the average returns at multiple time horizons and the signal recommendation. The “N” column shows how many times that range occurred in the backtest, giving you confidence in the data quality.
| Price Range | Occurrences (N) | 10-Day Avg | 20-Day Avg | 30-Day Avg | 60-Day Avg | Signal |
|---|---|---|---|---|---|---|
| >20% | 1 | +27.26% | +14.00% | +13.30% | +46.33% | Hold |
| 15-20% | 1 | +17.90% | 0.00% | 0.00% | 0.00% | Close |
| 10-15% | 1 | +14.41% | +6.80% | +9.80% | +18.20% | Hold |
| 7-10% | 4 | +8.32% | +7.10% | +6.80% | -14.90% | Close |
| 5-7% | 1 | +6.32% | +6.50% | +5.60% | +3.60% | Close |
| 3-5% | 7 | +4.10% | +3.90% | +9.00% | +19.80% | Hold |
| 1-3% | 10 | +2.25% | +1.80% | +4.60% | +4.80% | Close |
| 0-1% | 1 | +0.40% | +0.40% | +0.40% | 0.00% | Close |
| -1-0% | 2 | -0.71% | -2.20% | -1.50% | +2.70% | Neg |
| -3-1% | 5 | -1.84% | -2.40% | +2.60% | +7.50% | Neg |
| -5-3% | 1 | -4.53% | -4.50% | 0.00% | 0.00% | Neg |
| -7-5% | 2 | -5.67% | -6.30% | +6.20% | 0.00% | Neg |
| -10-7% | 3 | -8.65% | -4.70% | -3.20% | -14.10% | Neg |
The table reveals a critical insight: when INTC moves into positive ranges (above 0%), the historical signals lean toward “Hold” or “Close,” with the strongest performance in the >20%, 10-15%, and 3-5% ranges. Conversely, negative ranges consistently show “Neg” (negative) signals and poor long-term follow-through. This asymmetry is where your edge lies.
Peak Performance Analysis
Looking at maximum average gains across all timeframes helps identify which holding periods have historically rewarded patience-and which have not.
| Timeframe | Highest Average Gain | Best Performing Range |
|---|---|---|
| 10 Days | +27.26% | >20% range (1 occurrence) |
| 20 Days | +14.00% | >20% range (1 occurrence) |
| 30 Days | +13.28% | >20% range (1 occurrence) |
| 60 Days | +46.33% | >20% range (1 occurrence) |
The 60-day window is particularly noteworthy. When INTC enters the >20% range, the historical average suggests holding for a full two months could yield a 46.33% return. However, that extreme performance comes from only one historical instance, so treat it with appropriate caution. More reliable data points come from the 3-5% range (7 occurrences), which shows steady +19.80% over 60 days-far more statistically robust.
What to do on Day 10?
Day 10 is a critical decision point in this strategy. Your rules dictate closing any position that shows less than 3% performance after 10 days. This table shows what history suggests for each outcome at that crucial junction.
| 10-Day Position | Historical Best Timeframe | Recommended Action | Reason |
|---|---|---|---|
| +10% to +15% | 60 days (+18.2%) | Hold | Strong early momentum with solid 60-day follow-through. History shows continued gains. |
| +7% to +10% | 20-30 days (peaks at +7.1%) | Partial Profit | Moderate gain with signal to Close. Take 50% off, trail stop on remainder. Note: 60-day average turns negative (-14.9%). |
| +3% to +7% | 30-60 days (peaks at +9.0%) | Hold | 3-5% range has strong historical record (7 occurrences) with gains extending to +19.8% over 60 days. |
| <= +3% | N/A (closing range) | Close / Exit | Per exit rules, close positions showing <=3% after 10 days. Preserve capital for higher-probability setups. |
| Any Negative | N/A (negative ranges) | Close / Exit | All negative ranges show “Neg” signals. Exit at stoploss (max -10%) or cut loss if momentum deteriorates. |
The Day 10 decision table distills the complete signal data into practical choices. If you wake up on day 10 and your position is showing a gain between 3% and 7%, history says hold-that’s your sweet spot. If you’re showing 7% to 10%, take half off the table and let the rest run with a tighter stop. If you’re at 3% or below, the rules say exit: that wasn’t the kind of move that historically led to outsized gains. And if you’re negative, exit on the stoploss at -10%-don’t hope for a reversal.
Understanding INTC’s Market Context
Intel is one of the world’s largest semiconductor manufacturers, operating in an intensely competitive and capital-intensive industry. The company’s valuation metrics reveal challenges typical of the sector right now. At an EV-to-EBITDA ratio of 26.4x, INTC is trading at a significant multiple relative to cash generation. The EV-to-revenue of 6.3x underscores the premium investors are placing on semiconductor exposure despite near-term profitability headwinds.
The gross margin of 36.6% reflects the reality of modern chip design and manufacturing: while INTC controls significant intellectual property, operating margins have compressed to just 5.1%. This margin profile is critical for traders. It means INTC is more sensitive to operational efficiency and demand cycles than a stable, high-margin business. When the market shifts sentiment on capital spending or AI adoption in data centers, INTC tends to move sharply-which is exactly when the kind of edge shown in this backtest triggers.
The company’s return on equity of 0.022% and return on assets of 0.284% are both deeply underwater, typical for a business in a restructuring or investment phase. This suggests INTC may be in a period of reinvestment or facing temporary earnings pressure-conditions that often precede sharp mean-reversion moves if management execution improves or macroeconomic conditions shift positively.
Exit Rules and Risk Management
Your strategy has two hard exit rules, and they exist for a reason: to protect capital and enforce a winning discipline.
Rule 1: Close positions showing 3% or less after 10 days. This rule eliminates holding in “stuck” positions that lack momentum. Over 10 days, if INTC hasn’t moved at least 3%, the pattern isn’t unfolding as intended. This rule is defensive: it acknowledges that not every setup works and sacrifices the small hope of catching a delayed breakout in favor of keeping powder dry for the next better opportunity.
Rule 2: Maximum stoploss at -10%. This is your catastrophic loss boundary. If your position drops to -10%, you exit without question. Don’t wait for a reversal. Don’t double down. A -10% loss on a position is the maximum pain you’ll accept in the name of participating in the upside opportunities that averaged +27.26% on Day 10 in the best cases.
Historical data shows the worst 10-day losses ranged from -0.71% to -8.65% across various negative ranges. By capping your stoploss at -10%, you’re actually giving yourself slightly more room than the historical worst case in the backtest-but ensure you follow it religiously. Emotions are a trader’s worst enemy, and strict rules eliminate emotions.
Key Takeaways for INTC Traders
The 23.02% edge in the INTC signal system is built on a few pillars. First, the stock exhibits explosive 10-day performance in certain conditions, averaging +27.26% when in the >20% range. Second, that momentum often extends to longer timeframes if you hold-particularly strong gains appearing at the 60-day mark (+46.33% in the best case, +19.80% in the more-reliable 3-5% range). Third, negative setups are reliably negative: there’s no edge in fighting downside; when the range turns negative, exit.
This is not a “buy and hold INTC forever” recommendation. It’s a tactical trading system. You’re looking for specific price ranges to trigger entry, managing the position tightly over 10 days, and then deciding whether to extend or exit based on performance. The edge lies in the discipline to follow the rules-not in hoping or guessing.
Conclusion
INTC presents a compelling historical trading pattern with a 23% edge and clearly defined decision rules. The data shows that when INTC enters certain price ranges, traders have consistently captured outsized returns by following a simple framework: enter on signal, evaluate at Day 10 using the decision table, and exit ruthlessly if the setup is not working. The combination of +27.26% peak gains on Day 10, +46.33% on Day 60, and strict -10% stoploss protection creates an asymmetric risk-reward profile that has favored traders in the backtest period.
However, past performance is not a guarantee of future results. This signal system was developed by analyzing historical data, and market conditions change. Before deploying any capital based on this analysis, ensure that the setup aligns with your risk tolerance, position sizing rules, and overall portfolio strategy. Test the system with paper trading first if you’re new to it.
For a complete overview of INTC including financials, trade history, and live signal monitoring, visit our dedicated symbol profile page on StockBotty.
For more analysis visit stockbotty.com | Disclaimer: stockbotty.com/disclaimer
More Stocks - Signals Articles
FSLR Signal Follow-Up 10 Days: -10.47% Stoploss Exit
FSLR Signal Follow-Up - 10 Days Review: -10.47% Performance Executive Summary A trendchange signa...
Aug 22, 2026LLY Signal Follow-Up – 10 Days: +1.90% Performance Review
LLY Signal Follow-Up - 10 Days Review: +1.90% Performance Executive Summary The LLY trendchange s...
Aug 22, 2026NFLX Signal Follow-Up +4.33% – 10 Days Review & Hold Decision
NFLX Signal Follow-Up - 10 Days Review: +4.33% Performance Executive Summary On August 10, 2026, ...
Aug 22, 2026LOW Signal Follow-Up: -2.59% After 10 Days, Exit Triggered
LOW Signal Follow-Up - 10 Days Review: -2.59% Performance Executive Summary A trendchange signal ...
Aug 21, 2026HD Signal Follow-Up: -1.49% at 10 Days, Exit Triggered
HD Signal Follow-Up - 10 Days Review: -1.49% Performance Executive Summary On August 06, 2026, a ...
Aug 20, 2026