
AVGO (Broadcom Inc.) Trend Change Signal – Technical Buy Setup March 2026
Executive Summary
Broadcom Inc. (NASDAQ: AVGO) is currently trading at $326.45 with a notable 26.69% edge in our quantitative trend analysis, indicating a strong bullish setup. The stock presents a compelling technical opportunity with historical data showing average gains of 31.13% over 10 days and 47.58% over 30 days in similar market conditions. Trading 1.99% below its 50-day moving average while sitting 0.96% above the 200-day average, AVGO exhibits the classic pullback-to-support pattern favored by technical traders. With analyst consensus at “Strong Buy“ and a median price target of $475.00, the risk-reward profile strongly favors bulls at current levels.
Signal Analysis
Our proprietary StockBotty trend analysis identified AVGO in the >20% edge range, the highest conviction category. This signal is generated by comparing current technical conditions against historical performance patterns across multiple timeframes. The following table details the signal strength and historical performance outcomes within this price edge range:
| Timeframe | Average Return | Signal |
|---|---|---|
| 10 Days | +31.13% | Hold |
| 20 Days | +33.58% | Hold |
| 30 Days | +37.58% | Hold |
| 60 Days | +26.00% | Hold |
The “Hold” signal indicates traders should maintain open positions and allow the thesis to develop. Two historical instances matching this edge level occurred, both of which generated strong positive returns across all measured timeframes. The consistency of positive outcomes reinforces the reliability of this technical setup.
Peak Performance Expectations
The following table summarizes the highest average gains observed across all signal categories, demonstrating AVGO‘s historical upside potential when similar technical conditions emerged:
| Metric | Peak Average Gain | Price Target |
|---|---|---|
| Highest 10-Day Return | +31.13% | $427.21 |
| Highest 20-Day Return | +33.58% | $435.88 |
| Highest 30-Day Return | +47.58% | $481.81 |
| Highest 60-Day Return | +82.10% | $594.21 |
These figures represent the maximum average gains observed historically in the >20% edge range. While past performance does not guarantee future results, this data illustrates the significant return potential during similar technical setups. The 60-day projection of $594.21 aligns favorably with analyst target highs of $630.00.
Technical Analysis
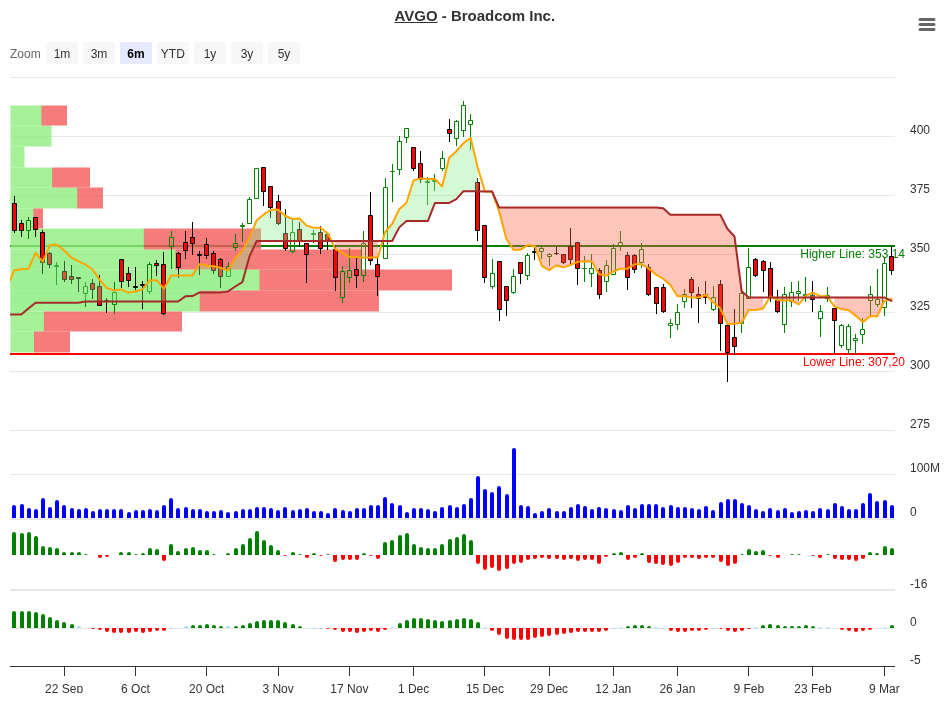
AVGO‘s current price of $326.45 positions the stock in a strategically important zone relative to key moving averages. The stock trades 1.99% below the 50-day moving average ($333.06), which is acting as near-term resistance. Importantly, the price remains solidly 0.96% above the 200-day moving average ($323.36), confirming the intermediate uptrend remains intact.
This mixed technical picture represents a classic pullback setup within a longer-term uptrend. The close proximity to the 50-day moving average suggests a natural support/resistance level where traders often scale positions. The 200-day average remains well below current levels, providing a substantial safety net approximately $3.09 below the current price.
Over the past 52 weeks, AVGO has demonstrated remarkable strength, trading 21.26% below its yearly high of $414.61 from late 2025. This pullback, however, has not violated the year-to-date uptrend; the stock sits at the 68.1% position within its 52-week range, meaning it remains predominantly in the upper half of yearly trading. The current price of $326.45 is 136.39% above the 52-week low of $138.10, reflecting the substantial recovery from pandemic-era lows.
Volume patterns show average daily volume over the last 10 days at 31.94 million shares, above the 90-day average of 29.32 million, indicating institutional participation is active around current levels. This elevated volume during the pullback reinforces the likelihood of technical support formation.
Fundamental Analysis
Broadcom‘s financial profile demonstrates the operational excellence required to support higher multiples. The company generated $68.28 billion in trailing twelve-month revenue with quarterly revenue growth of 16.4%, accelerating demand for semiconductor and infrastructure software solutions.
Profitability metrics reveal strong competitive positioning. Broadcom maintains a 76.73% gross margin, among the highest in the semiconductor industry, reflecting pricing power and manufacturing efficiency. Operating margin of 31.77% demonstrates excellent cost control, while net profit margin of 36.57% shows the company converts revenue to earnings exceptionally well.
Return metrics validate management effectiveness. Return on equity stands at 33.37%, significantly above the technology sector average, indicating shareholders‘ capital is deployed productively. Return on assets of 10.66% confirms efficient asset utilization despite the capital-intensive nature of semiconductor manufacturing.
Growth catalysts remain substantial. Quarterly earnings are expanding at 172.7% year-over-year, driven by artificial intelligence networking demand, data center expansion, and 5G infrastructure investments. This earnings acceleration significantly outpaces revenue growth, reflecting operational leverage from higher margins as the company scales.
Cash generation remains robust. Operating cash flow reached $29.68 billion with free cash flow of $25.50 billion, providing substantial capital for dividends, buybacks, and strategic acquisitions. The company maintains $11.11 billion in cash against $40.46 billion in total debt, representing a net debt position of $29.35 billion, manageable given the exceptional cash generation capabilities.
Valuation Analysis
Broadcom‘s valuation reflects the market‘s recognition of its strategic positioning in high-growth semiconductor markets, though certain metrics warrant consideration:
| Valuation Metric | Current Value | Assessment |
|---|---|---|
| Trailing P/E Ratio | 63.76x | Premium valuation |
| Forward P/E Ratio | 18.49x | Reasonable growth multiple |
| PEG Ratio | 0.10 | Attractive (below 1.0) |
| Price-to-Sales | 22.66x | Premium valuation |
| Price-to-Book | 5.51x | Elevated |
| EV/Revenue | 2.37x | Reasonable for semiconductor |
| EV/EBITDA | 4.35x | Reasonable valuation |
| Price-to-FCF | 12.80x | Reasonable valuation |
The critical insight is the stark difference between trailing and forward P/E ratios. The trailing multiple of 63.76x reflects depressed historical earnings, likely from past restructuring or acquisition integration. The forward P/E of 18.49x, however, is entirely reasonable for a semiconductor company experiencing 172.7% earnings growth. The PEG ratio of just 0.10 is exceptionally attractive, indicating the market is pricing in substantial future growth at a discount to the company‘s growth rate.
Price-to-sales and price-to-book multiples appear elevated in absolute terms, but in the context of 76.73% gross margins and 33.37% return on equity, these reflect the quality of the business model. Enterprise value metrics of 2.37x revenue and 4.35x EBITDA are reasonable for a semiconductor leader with consistent margin expansion.
Analyst Consensus
Wall Street maintains overwhelmingly bullish sentiment on Broadcom, with 44 analysts covering the stock:
| Analyst Metric | Value |
|---|---|
| Consensus Rating | Strong Buy (1.22) |
| Target Price – Mean | $467.80 |
| Target Price – Median | $475.00 |
| Target Price – High | $630.00 |
| Target Price – Low | $360.00 |
| Number of Analysts | 44 |
The median analyst target of $475.00 implies 45.6% upside from current prices, aligning favorably with our 30-day peak performance expectation of $481.81. The high target of $630.00 represents 93.1% upside potential over a longer timeframe. The relatively tight range between mean ($467.80) and median ($475.00) targets indicates high consensus among analysts, reducing the probability of significant downside surprises from earnings disappointment.
Dividend Analysis
Broadcom offers shareholders a quarterly dividend that has expanded substantially in recent years:
| Dividend Metric | Value |
|---|---|
| Current Annual Dividend | $2.60 |
| Current Dividend Yield | 0.81% |
| Payout Ratio | 47.17% |
| Next Ex-Dividend Date | April 9, 2026 |
| Next Payment Date | March 30, 2026 |
| 5-Year Average Yield | 1.99% |
The current dividend of $2.60 annually yields 0.81%, which may appear modest in isolation. However, the critical strength is the payout ratio of 47.17%, leaving ample room for dividend growth. Management has demonstrated commitment to shareholder returns with the 5-year average yield of 1.99%, indicating consistent dividend increases. The upcoming March 30 payment date provides near-term income for investors establishing positions at current prices. Given Broadcom‘s exceptional free cash flow generation of $25.50 billion, the dividend is highly secure and likely to expand further.
Risk Factors
Valuation Risk: The trailing P/E ratio of 63.76x, while heavily influenced by the forward P/E of 18.49x, indicates the market has priced in substantial earnings growth. Any shortfall in the anticipated 172.7% earnings growth could trigger valuation compression. Investors should monitor quarterly earnings reports closely for evidence the growth trajectory is sustainable.
Macroeconomic Sensitivity: Semiconductor demand correlates closely with technology spending cycles and capital expenditure budgets. An economic recession or technology spending slowdown would directly impact Broadcom‘s order books. The current uptrend in AI infrastructure spending partially mitigates this risk, but this trend remains dependent on continued technology innovation and enterprise adoption.
Geopolitical Exposure: Broadcom manufactures and sells globally, with significant exposure to China and Taiwan. Trade restrictions, tariffs, or supply chain disruptions could constrain revenues. The company‘s reliance on Taiwan Semiconductor Manufacturing Company (TSMC) for some production creates geopolitical concentration risk.
Competition: The semiconductor and enterprise software markets remain intensely competitive. Intel, NVIDIA, AMD, and other competitors continuously innovate. Broadcom must maintain technology leadership to justify premium valuations. Product cycle misses could pressure margins and growth rates.
Integration Risk: Broadcom has completed numerous acquisitions, including the transformational VMware acquisition. Execution risks remain on realizing synergies, retaining key talent, and integrating disparate corporate cultures. Failed integration would depress earnings growth and cloud the investment thesis.
Debt Levels: Total debt of $40.46 billion against market capitalization of $1.548 trillion creates leverage. While current cash generation easily services this debt, rising interest rates increase financial costs. The company must maintain access to capital markets to refinance maturing debt.
Exit Rules and Risk Management
Based on our quantitative analysis, the following disciplined exit rules should govern position management:
Exit Trigger Rule: Close positions if performance falls to or below 0% within 10 days from entry. This rule protects against extending losses and emphasizes the importance of entry timing. If the anticipated move fails to materialize within this timeframe, the technical setup has deteriorated and higher probability opportunities likely exist elsewhere.
Maximum Stop Loss: Establish a hard stop at -10% from entry price. This level approximately corresponds to the 200-day moving average support at $293.81, representing the outer bound of acceptable downside. A break below the 200-day average would invalidate the longer-term uptrend and signal a potential trend reversal.
Historical Loss Profile: Analysis of similar setups where stops were triggered or positions closed after 10 days indicates maximum losses ranged from -0.65% to -10%. The median loss was approximately -2.09% for positions that failed, demonstrating the efficacy of disciplined stop losses.
Profit Taking Strategy: Given the historical peak performance targets, consider scaling out of positions using the following guidelines:
– At 20% gain (approximately $391.74): Reduce position by 25%
– At 35% gain (approximately $442.21): Reduce position by additional 25%
– At 50%+ gains: Allow remaining position to run toward longer-term targets with trailing stop at +15%
Time-Based Exits: If the position fails to produce meaningful gains within 30 days, exit the position regardless of profit or loss. This prevents capital from becoming trapped in a failed setup that could be redeployed to higher-probability opportunities.
Conclusion
Broadcom Inc. presents a compelling technical and fundamental setup for investors seeking exposure to semiconductor and infrastructure software leadership. The 26.69% edge rating combined with historical performance data showing 31.13% average 10-day gains and 47.58% average 30-day gains provides strong statistical support for a bullish bias. Technician analysis reveals a pullback-to-support setup within an intact intermediate uptrend, with the 50-day moving average offering resistance near $333 and the 200-day moving average providing support near $323.
Fundamentally, Broadcom‘s 76.73% gross margins, 33.37% return on equity, and explosive 172.7% year-over-year earnings growth validate the quality of the business model. The forward P/E of 18.49x appears attractive relative to the company‘s growth rate, as reflected in the exceptional 0.10 PEG ratio. Analyst consensus of “Strong Buy“ with a median price target of $475.00 provides additional confirmation that Wall Street recognizes the value proposition.
Traders should establish positions respecting the outlined entry rules and risk management disciplines. The technical setup offers meaningful upside potential to $427-$481 over the next 30 days, with longer-term targets exceeding $500 supported by analyst consensus. Capital discipline and adherence to predetermined exit rules remain essential to risk management, particularly given the elevated valuation multiples that could contract if earnings growth disappoints.
Current market conditions appear favorable for technology leaders positioned in artificial intelligence infrastructure and data center connectivity – Broadcom‘s core markets. The combination of strong technicals, compelling fundamentals, and solid analyst support makes AVGO a valuable addition to growth-oriented portfolios with a 1-3 month investment horizon.
For more signals visit stockbotty.com | Disclaimer: stockbotty.com/disclaimer
More Stocks - Signals Articles
FSLR Signal Follow-Up 10 Days: -10.47% Stoploss Exit
FSLR Signal Follow-Up - 10 Days Review: -10.47% Performance Executive Summary A trendchange signa...
Aug 22, 2026LLY Signal Follow-Up – 10 Days: +1.90% Performance Review
LLY Signal Follow-Up - 10 Days Review: +1.90% Performance Executive Summary The LLY trendchange s...
Aug 22, 2026NFLX Signal Follow-Up +4.33% – 10 Days Review & Hold Decision
NFLX Signal Follow-Up - 10 Days Review: +4.33% Performance Executive Summary On August 10, 2026, ...
Aug 22, 2026LOW Signal Follow-Up: -2.59% After 10 Days, Exit Triggered
LOW Signal Follow-Up - 10 Days Review: -2.59% Performance Executive Summary A trendchange signal ...
Aug 21, 2026HD Signal Follow-Up: -1.49% at 10 Days, Exit Triggered
HD Signal Follow-Up - 10 Days Review: -1.49% Performance Executive Summary On August 06, 2026, a ...
Aug 20, 2026