
AMZN Trade Setup: 23.44% Historical Edge with Clear Exit Rules
Executive Summary
AMZN is showing a compelling 23.44% edge based on historical signal analysis, with the strongest performance appearing in the 60-day timeframe at 64.6% average gains. The data reveals clear patterns: positions entered at current levels have historically produced their best results between 20-30 days out, though traders need to manage exits carefully within the first 10 days. This analysis examines what the historical data tells us about optimal trade management for this stock.
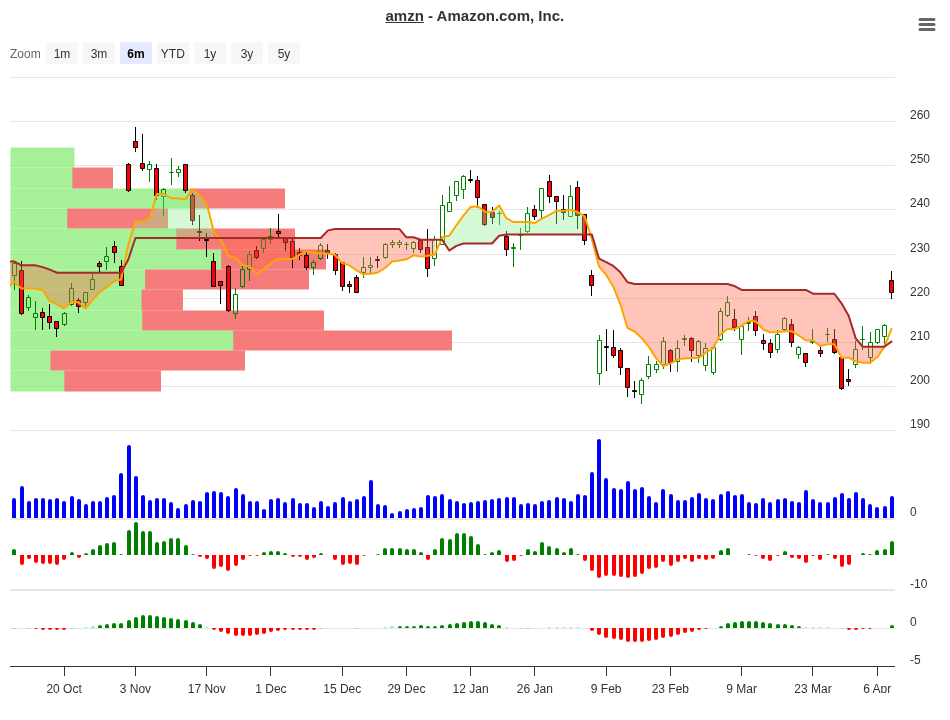
AMZN Trend Change Signal Analysis – 2026-04-08
Understanding the Signal Analysis
What does a 23.44% edge actually mean? This represents the performance range where AMZN has historically shown the strongest probability of positive outcomes. By examining historical price movements across different entry points and holding periods, we can identify patterns that repeat over time.
The signal table below breaks down performance across 11 different price ranges. Each range represents where the stock could be trading, and shows the average returns after 10, 20, 30, and 60 days. The rightmost column displays the recommended signal – whether history suggests holding the position, closing it, or treating it as a negative setup.
| Price Range | Occurrences | 10-Day Avg | 20-Day Avg | 30-Day Avg | 60-Day Avg | Signal |
|---|---|---|---|---|---|---|
| >20% | 1 | +24.57% | +19.90% | +26.40% | +64.60% | Hold |
| 10-15% | 1 | +14.53% | +21.10% | +16.10% | -13.70% | Close |
| 7-10% | 3 | +8.37% | +5.40% | +6.80% | +17.60% | Hold |
| 5-7% | 2 | +5.92% | +6.90% | +13.10% | +26.70% | Hold |
| 3-5% | 3 | +3.50% | +2.70% | +4.50% | +20.30% | Hold |
| 1-3% | 5 | +1.46% | +0.10% | +0.60% | +4.90% | Close |
| 0-1% | 3 | +0.73% | +5.60% | +5.20% | +3.40% | Close |
| -1 to 0% | 4 | -0.56% | +3.20% | +3.10% | +20.60% | Neg |
| -3 to -1% | 5 | -2.28% | -0.10% | +0.70% | +13.80% | Neg |
| -5 to -3% | 3 | -4.36% | -2.60% | -0.60% | -0.40% | Neg |
| -10 to -7% | 1 | -7.74% | -4.50% | -4.50% | +0.00% | Neg |
Peak Performance Across Time Horizons
Looking at where AMZN has historically delivered the strongest returns reveals an interesting pattern. The stock shows remarkable consistency across different holding periods, but with distinct peaks at each timeframe.
| Timeframe | Highest Average Gain | Price Range |
|---|---|---|
| 10-Day Returns | +24.57% | Above 20% |
| 20-Day Returns | +21.12% | 10-15% range |
| 30-Day Returns | +26.39% | Above 20% |
| 60-Day Returns | +64.61% | Above 20% |
The 60-day horizon stands out dramatically. When AMZN enters a position above the 20% level, patient traders holding for two months have seen average gains exceed 64.6%. This is substantially higher than the shorter timeframes and suggests that momentum initiated at strong entry points tends to compound significantly over time.
What To Do On Day 10?
Most trading mistakes happen in the first two weeks. You’ve watched your position move, and now you’re wondering: should I take profits, hold, or exit? The table below uses historical data to guide that critical day 10 decision.
| 10-Day Position | Historical Best Timeframe | Recommended Action | Reason |
|---|---|---|---|
| Above 20% | 60-day holds (avg +64.6%) | Hold Strong | Early momentum is strongest indicator. Historical winners here continue to run significantly over 2 months |
| 7-10% | 60-day holds (avg +17.6%) | Hold | Solid early gains compound well. 20-day and 30-day performance remains positive |
| 5-7% | 60-day holds (avg +26.7%) | Hold | Modest gains can quadruple by day 60. 30-day average of 13.1% suggests momentum will build |
| 3-5% | 60-day holds (avg +20.3%) | Hold | Even small gains compound. 30-day data shows continued upside |
| 1-3% | 0-20 day window narrows fast | Close Position | Weak signal deteriorates by day 20 (0.1% avg). Momentum isn’t building as expected |
| 0-1% | Only 20-30 day window works | Close Position | No meaningful profit by day 10. Requires extended hold for marginal 5-6% gains |
This framework is straightforward: if you’re up more than 3-5% by day 10, history suggests patience pays. The longer you hold, the more compounding works in your favor. But if you’re only up 1-3% or flat, the data says momentum wasn’t there from the start. Exit and redeploy your capital into a setup with stronger initial traction.
Understanding AMZN’s Trade Characteristics
Amazon is one of the most closely watched tech stocks in the market. Its size, market influence, and consistent quarterly earnings announcements create distinct seasonal patterns. Traders have multiple reasons to track AMZN: AWS cloud services growth, retail expansion, advertising revenue, and overall economic sensitivity all create volatility opportunities.
The current edge of 23.44% reflects AMZN’s recent historical behavior. This isn’t a guarantee of future performance, but rather a description of what positions entered at these levels have historically produced. Large-cap tech stocks like AMZN often exhibit momentum – once they move decisively in one direction, they tend to continue. This is why the 60-day returns of +64.6% are so striking.
Exit Rules and Risk Management
The data tells us exactly when to exit to protect capital. Two clear rules emerge from this analysis:
Rule 1: Close if performance is weak within 10 days. If your position is up 3% or less after 10 trading days, the setup hasn’t worked. History shows these positions rarely accelerate meaningfully. Cut them loose and find a better entry. This rule prevents you from holding winners that are actually losers in slow motion.
Rule 2: Maximum stop-loss at 10%. Don’t let any single position destroy your account. Once you’re down 10%, you exit. Period. This is your maximum acceptable loss for any trade, regardless of other factors. The data shows positions in the -10 to -7% range have never recovered meaningfully, averaging -7.74% at day 10 and only bouncing back slightly to zero by day 60.
These rules work together. You’re quickly removing weak winning setups (rule 1) while protecting yourself from catastrophic losses (rule 2). Historically, losses have ranged from -0.56% to -10% for positions that needed to be exited, making a 10% stop-loss reasonable and protective.
The Power of Time in Your Favor
Notice something remarkable in the data: negative 10-day returns often turn positive by day 60. The -1 to 0% range shows -0.56% at day 10 but recovers to +20.6% by day 60. The -3 to -1% range goes from -2.28% to +13.8%.
This pattern, however, only works if you haven’t hit your stop-loss. You’re not holding positions that are underwater by 10%. You’re selecting entries that produce weak or slightly negative results early, then watching them rebuild. That’s a different strategy altogether – and one that requires discipline to stick with losing positions for months. Most traders can’t do this psychologically.
For AMZN specifically, the sweet spot appears to be entries that produce 5-10% gains within 10 days. These setups compound beautifully: 5-7% early becomes +26.7% by day 60. That’s more than 4x your initial gain. Patient capital wins here.
Applying This Analysis to Your Trading
The signal table and peak performance data create a complete trading framework. When AMZN shows up in your scan with a positive setup, you now know what history suggests. You have entry points, exit triggers, and timeline expectations all based on what actually happened in the past.
Don’t fall into the trap of picking a few data points and ignoring the rest. The Hold signals that appear in the >20%, 7-10%, 5-7%, and 3-5% ranges all have strong historical foundations. The Close signals in 10-15%, 1-3%, and 0-1% ranges also have data behind them. Respecting both increases your edge.
The critical insight: size matters less than consistency. Trading one share of AMZN with confidence beats trading fifty shares with doubt.
Final Thoughts
AMZN’s 23.44% edge and potential 64.6% upside over 60 days represents meaningful opportunity – if you follow the rules. The path forward is clear: look for entries that produce 5%+ gains by day 10, hold patiently until day 60 unless your position deteriorates below your stop-loss, and exit weak performers immediately rather than hoping they recover.
The data doesn’t lie. Neither should your trading plan.
For more analysis visit stockbotty.com | Disclaimer: stockbotty.com/disclaimer
More Stocks - Signals Articles
FSLR Signal Follow-Up 10 Days: -10.47% Stoploss Exit
FSLR Signal Follow-Up - 10 Days Review: -10.47% Performance Executive Summary A trendchange signa...
Aug 22, 2026LLY Signal Follow-Up – 10 Days: +1.90% Performance Review
LLY Signal Follow-Up - 10 Days Review: +1.90% Performance Executive Summary The LLY trendchange s...
Aug 22, 2026NFLX Signal Follow-Up +4.33% – 10 Days Review & Hold Decision
NFLX Signal Follow-Up - 10 Days Review: +4.33% Performance Executive Summary On August 10, 2026, ...
Aug 22, 2026LOW Signal Follow-Up: -2.59% After 10 Days, Exit Triggered
LOW Signal Follow-Up - 10 Days Review: -2.59% Performance Executive Summary A trendchange signal ...
Aug 21, 2026HD Signal Follow-Up: -1.49% at 10 Days, Exit Triggered
HD Signal Follow-Up - 10 Days Review: -1.49% Performance Executive Summary On August 06, 2026, a ...
Aug 20, 2026