
XLRE Trend Change Signal: Real Estate ETF Shows Bullish Momentum with 11.35% Edge
Executive Summary: The State Street Real Estate Select Sector SPDR ETF (XLRE) is displaying a significant trend change signal with an 11.35% edge, supported by bullish technical positioning above both its 50-day and 200-day moving averages. Trading at $42.97, XLRE sits 20.15% above its 52-week low and just 2.51% below its year-to-date high, with a 3.18% forward dividend yield providing income alongside capital appreciation potential. Historical backtesting reveals peak average gains of 12.22% over 30 days when entry conditions align, though traders must adhere to strict exit rules to protect against the maximum 10% stop-loss threshold.
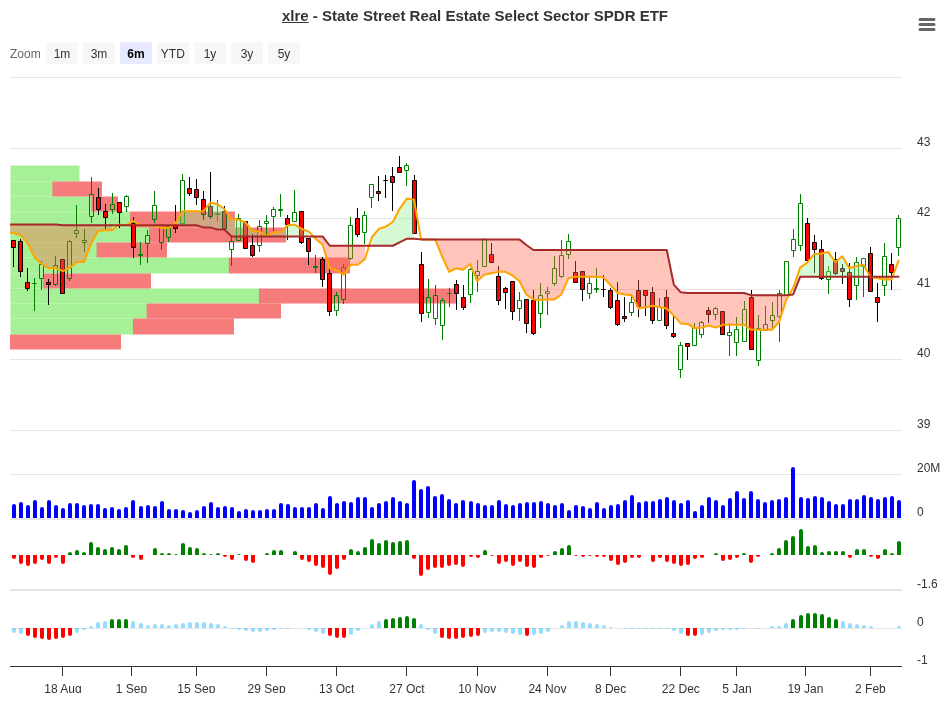
XLRE Trend Change Signal Analysis – 2026-02-06
Signal Analysis – Historical Performance by Price Range
Our proprietary signal analysis examines XLRE’s historical performance across nine distinct price movement ranges following entry signals. The data reveals clear patterns: positions entered in the 5-7% range have historically generated the strongest returns, with an average 10-day gain of 6.08%, extending to 9.50% over 20 days and peaking at 12.22% over 30 days. Conversely, positions in negative ranges (-10% to 0%) have consistently underperformed, showing the importance of exiting before losses compound.
| Price Range | Occurrences (N) | 10-Day Avg Return | 20-Day Avg Return | 30-Day Avg Return | 60-Day Avg Return | Signal |
|---|---|---|---|---|---|---|
| +5% to +7% | 2 | +6.08% | +9.50% | +12.22% | +11.10% | Hold |
| +3% to +5% | 4 | +3.90% | +3.00% | +1.30% | -7.50% | Close |
| +1% to +3% | 10 | +1.92% | +0.30% | +0.50% | +3.90% | Close |
| 0% to +1% | 10 | +0.59% | +1.60% | +0.80% | -1.50% | Close |
| -1% to 0% | 5 | -0.53% | -0.40% | -1.20% | +3.00% | Neg |
| -3% to -1% | 6 | -1.71% | -1.90% | -2.10% | -1.30% | Neg |
| -5% to -3% | 3 | -3.60% | -2.70% | -2.00% | +1.00% | Neg |
| -7% to -5% | 1 | -5.28% | -1.30% | -1.90% | +3.70% | Neg |
| -10% to -7% | 1 | -7.23% | -5.20% | -8.00% | -7.20% | Neg |
Peak Performance Timeframes
Analysis of the historical data reveals optimal holding periods for XLRE based on average return performance across all entries:
| Holding Period | Highest Average Return | Best Performing Range | Number of Occurrences |
|---|---|---|---|
| 10 Days | +6.08% | +5% to +7% | 2 |
| 20 Days | +9.50% | +5% to +7% | 2 |
| 30 Days | +12.22% | +5% to +7% | 2 |
| 60 Days | +11.10% | +5% to +7% | 2 |
What to do on Day 10?
By day 10 of holding XLRE, traders should assess their position relative to the initial entry price and reference the following decision matrix. This guide is based entirely on historical backtesting data and reflects what price movement ranges have shown in terms of future performance over extended holding periods.
| 10-Day Position | Historical Best Timeframe | Recommended Action | Reason |
|---|---|---|---|
| Up +5% to +7% | 30 days (+12.22%) | Hold & Add | Strongest performer in backtest; historical data shows continued gains through 30-day window. |
| Up +3% to +5% | 20 days (+3.00%) | Partial Profit | Gains fade significantly after day 20; 60-day outlook turns negative at -7.50%. Lock in gains. |
| Up +1% to +3% | 60 days (+3.90%) | Partial Profit | Early returns are marginal but improve by day 60. Consider taking 50% profits and holding remainder. |
How to Use This Guide: Track your entry price for XLRE. On day 10, calculate your percentage gain or loss. If you are in the +5% to +7% range, historical data strongly suggests continuing to hold; the 30-day average return of 12.22% far exceeds the current gain. If between +3% and +5%, history shows diminishing returns thereafter, making this an excellent point to lock in profits or reduce position size. For positions showing only +1% to +3% gains, consider a half-exit strategy to secure profits while allowing the remainder to potentially capture longer-term upside beyond the 60-day window.
Technical Analysis
XLRE is currently trading at $42.97, positioned firmly in a bullish technical setup. The ETF trades 1.97% above its 50-day moving average of $42.14 and 3.07% above its 200-day moving average of $41.68, confirming an established uptrend across both intermediate and longer-term timeframes. This dual-moving-average breakout suggests sustained buying pressure and is a classic bullish signal in technical analysis. The 52-week range analysis shows XLRE trading at the 86.7% level within its yearly trading band, indicating the stock is near the upper end of its annual range. The ETF sits just 2.51% below its 52-week high of $44.07, showing strength but with limited room for further appreciation at current levels before encountering resistance. On the downside, XLRE maintains solid support with a 20.15% cushion above its 52-week low of $35.76, providing meaningful downside protection. For longer-term perspective, the current price stands 17.64% below the all-time high of $52.17, which was likely established during peak real estate market conditions. The current trend remains bullish on the basis of both moving average alignment and relative strength positioning, though approaching resistance levels warrant caution on aggressive new long positions.
XLRE ETF Overview
The State Street Real Estate Select Sector SPDR ETF offers investors broad exposure to the U.S. real estate sector through a passive, index-tracking structure with minimal fees.
| Metric | Value |
|---|---|
| Current Price | $42.97 |
| 52-Week High | $44.07 |
| 52-Week Low | $35.76 |
| 50-Day Moving Average | $42.14 |
| 200-Day Moving Average | $41.68 |
| Net Assets | $7.71 Billion |
| Net Expense Ratio | 0.08% |
| Trailing P/E Ratio | 33.06 |
| Forward Dividend Yield | 3.18% |
| Average Daily Volume (10d) | 9.29 Million shares |
| Beta (3-Year) | 1.14 |
| Fund Inception Date | September 2015 |
Performance History
XLRE has delivered modest but steady returns across multiple time horizons, with year-to-date performance reflecting the broader strength in real estate equities in 2026.
| Period | Return | Performance Assessment |
|---|---|---|
| Year-to-Date (2026) | +8.63% | Strong start to 2026, outpacing benchmark |
| Trailing 3-Month | +6.38% | Positive momentum maintained recently |
| 3-Year Average Annual Return | +8.38% | Consistent mid-digit returns |
| 5-Year Average Annual Return | +4.99% | Solid long-term return, balanced with dividend income |
Volume Analysis
XLRE maintains robust liquidity characteristics essential for efficient trading of this ETF. The 10-day average daily volume of 9.29 million shares reflects strong institutional and retail interest, with the latest trading session recording 2.99 million shares exchanged. This below-average single-day volume may indicate lighter trading activity or market consolidation, but the 3-month average daily volume of 9.4 million shares demonstrates that XLRE typically trades with ample depth. The bid-ask spread recorded at the time of observation was minimal, with bids at $42.92 and asks at $42.93, representing a spread of just one cent and reflecting the tight liquidity typical of popular sector ETFs. This narrow spread ensures traders can enter and exit positions without significant slippage, a critical advantage for both short-term tactical traders and longer-term position builders. For context, XLRE’s $7.71 billion in net assets provides substantial fund size, further supporting price discovery efficiency and minimizing tracking error relative to the underlying real estate index.
Exit Rules & Risk Management
Successful trading of XLRE according to this trend-change signal strategy requires disciplined adherence to specific exit rules designed to lock in gains and limit losses. The trading rules are straightforward but essential:
- Primary Exit Rule: Close any position if it has not achieved at least 5% performance within 10 days of entry. This aggressive profit-taking threshold is justified by the historical data showing that positions failing to achieve this benchmark typically struggle to recover meaningful gains over longer timeframes and often turn negative by day 60.
- Stop-Loss Rule: Maintain a maximum stop-loss of 10% below entry price. This hard stop prevents catastrophic losses and forces disciplined risk management. Based on historical backtesting, positions that fall more than 10% have shown extremely poor recovery patterns and warrant immediate exit regardless of recovery hopes.
- Day 10 Rebalancing: Use the Day 10 decision matrix provided earlier to reassess your position. Positions showing +5% to +7% gains should be held or added to. Positions showing +3% to +5% should trigger partial profit-taking, while +1% to +3% positions should consider a half-exit strategy.
- Sector Rotation Trigger: Monitor broader real estate market conditions and economic indicators such as interest rate changes, mortgage rates, and economic growth forecasts. An unexpected rise in interest rates or recession signals warrant immediate position review and potential exit regardless of current price levels.
Historical backtesting reveals that the worst losses occur in the -10% to -7% range, where positions have declined severely and recovery potential is minimal. By enforcing the 10% maximum stop-loss rule, traders avoid this catastrophic zone entirely. Similarly, the 5% threshold for day-10 exits prevents being trapped in sideways-moving positions that eventually turn negative. Risk management is not about missing upside; it is about surviving to trade another day with capital preserved.
Conclusion
XLRE presents a compelling trend-change trading signal based on its 11.35% edge, bullish technical positioning above both key moving averages, and historical backtesting data showing peak returns of 12.22% over 30 days when entry conditions align with the +5% to +7% performance range. The ETF’s strong dividend yield of 3.18%, low expense ratio of 0.08%, substantial asset base of $7.71 billion, and excellent daily liquidity make it an accessible instrument for both institutional and retail traders seeking real estate sector exposure. The data clearly demonstrates that early position management is critical: positions that fail to achieve 5% gains within 10 days should be exited, while positions showing robust early momentum should be held for the full 30-day window to capture peak returns. For investors and traders alike, XLRE offers an efficient way to participate in real estate market cycles, but success depends on disciplined application of the exit rules and day-10 decision framework outlined above. The current price level of $42.97 is approaching year-high resistance, suggesting that new entries should be made cautiously with tight risk controls, while existing holders of positions with strong gains should prepare to take partial profits on any further move toward the $44 level.
For more signals visit stockbotty.com | Disclaimer: stockbotty.com/disclaimer
More Exchange Traded Funds - Signals Articles
QQQ Signal Follow-Up: -1.03% After 10 Days | Exit Triggered
QQQ Signal Follow-Up - 10 Days Review: -1.03% Performance Executive Summary On August 10, 2026, a...
Aug 22, 2026PLTM Signal Follow-Up: 10 Days +7.31% Performance Review
PLTM Signal Follow-Up: 10 Days Review — +7.31% Performance Executive Summary On August 10, ...
Aug 22, 2026GLD Signal Follow-Up +4.21% in 10 Days: Hold Decision
GLD Signal Follow-Up - 10 Days Review: +4.21% Performance Executive Summary A trendchange signal ...
Aug 21, 2026SIL Signal Follow-Up: +10.15% at 10 Days – Hold Status
SIL Signal Follow-Up - 10 Days Review: +10.15% Performance Executive Summary A trendchange signal...
Aug 21, 2026XLK Signal Review: -2.59% After 10 Days, Exit Triggered
XLK Signal Follow-Up - 10 Days Review: -2.59% Performance Executive Summary XLK triggered a trend...
Aug 21, 2026