
XLC (State Street Communication Services Select Sector SPDR ETF) – Trend Change Signal Analysis for March 2026
Executive Summary
XLC, the State Street Communication Services Select Sector SPDR ETF, is trading at $116.03 with a notable 12.31% edge signal indicating potential trading opportunities in the communication services sector. The ETF’s technical position shows a mixed trend, trading below its 50-day moving average ($116.75) but above its 200-day average ($113.01), positioning it in a consolidation phase. With $27.2 billion in net assets and a competitive 0.08% expense ratio, XLC provides broad exposure to telecommunications, media, entertainment, and interactive media companies. Historical backtest data reveals the strongest performance emerges in the 5-7% and 3-5% price ranges over 20-60 day periods, with potential gains reaching 17.79% in specific scenarios.
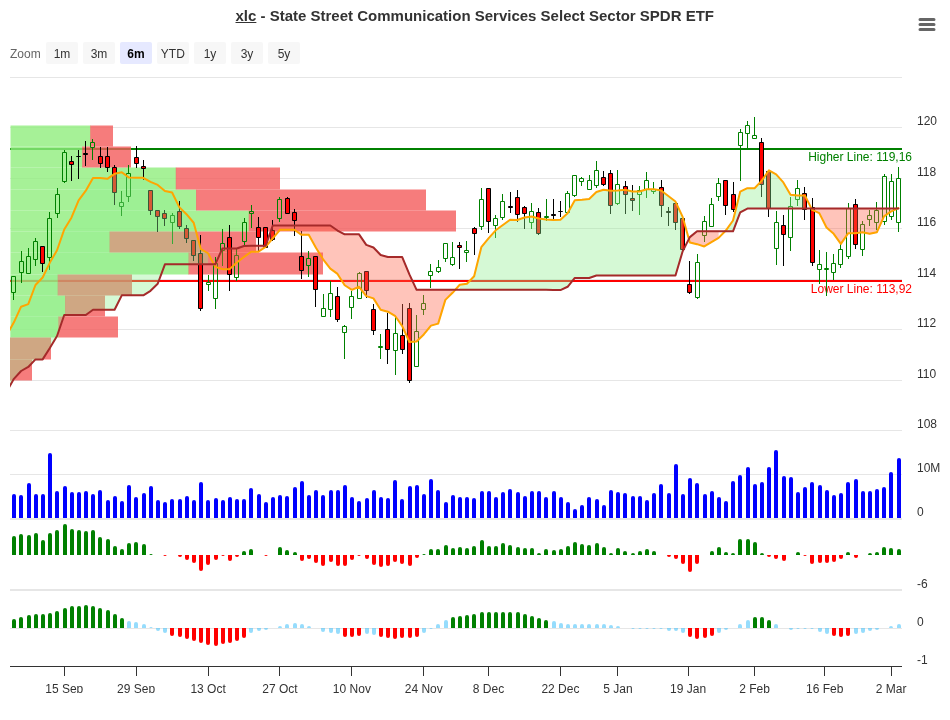
XLC Trend Change Signal Analysis – 2026-03-03
Signal Analysis – Complete Historical Performance Table
The following table presents the complete backtest signal history for XLC, organized by price range over multiple time horizons. This data reflects how the ETF has historically performed when entering trades at specific price points relative to key resistance or support levels.
| Price Range | Sample Size (N) | 10-Day Avg Return | 20-Day Avg Return | 30-Day Avg Return | 60-Day Avg Return | Signal |
|---|---|---|---|---|---|---|
| +5% to +7% | 1 | +5.15% | +14.30% | +5.90% | +14.70% | Hold |
| +3% to +5% | 5 | +4.06% | +2.50% | +6.20% | +17.79% | Hold |
| +1% to +3% | 7 | +2.05% | +2.20% | +1.60% | +7.70% | Close |
| 0% to +1% | 3 | +0.34% | +0.70% | +2.10% | -1.50% | Close |
| -1% to 0% | 2 | -0.45% | -0.70% | +1.20% | +6.40% | Neg |
| -3% to -1% | 2 | -1.83% | -0.70% | 0.00% | 0.00% | Neg |
| -5% to -3% | 3 | -3.98% | -8.70% | -10.40% | -18.10% | Neg |
Peak Performance Analysis – Highest Average Returns by Timeframe
This table identifies the maximum average returns achievable within each analysis window, providing insight into the optimal holding periods for XLC trades.
| Timeframe | Highest Average Return | Associated Price Range |
|---|---|---|
| 10-Day | +5.15% | +5% to +7% range |
| 20-Day | +14.31% | +5% to +7% range |
| 30-Day | +6.19% | +3% to +5% range |
| 60-Day | +17.79% | +3% to +5% range |
What to Do on Day 10? – Decision Guide
The following guide translates historical backtest data into actionable trading decisions. Based on the price position after your initial 10-day holding period, this table shows what history suggests you should do next – whether to hold, add to your position, take partial profits, or exit completely.
| 10-Day Position | Historical Best Timeframe | Recommended Action | Reason |
|---|---|---|---|
| +5% to +7% Gain | 20-Day & 60-Day (14.31% & 14.70%) | Hold & Add | Strongest historical momentum. Data shows potential for 14%+ returns over next 50 days. Consider adding on dips. |
| +3% to +5% Gain | 60-Day (17.79%) – Best performer | Hold & Add | Exceptional 60-day upside (17.79%). This range shows the highest longer-term potential. Avoid early exits. |
| +1% to +3% Gain | 60-Day (7.70%) – Modest follow-through | Partial Profit | Weak 10-day start with mediocre follow-through. Take 30-40% profit; hold remainder with tighter stops. |
| 0% to +1% Gain | 30-Day (2.10%) – Poor momentum | Close/Exit | Essentially flat at 10 days with negative 60-day result (-1.50%). Close position and move capital elsewhere. |
How to Use This Guide: After holding XLC for 10 days, identify which price range your position has achieved. Match that row in the table above to see what historical data suggests. Positions in the +3% to +7% range show the most promise for longer-term gains and warrant holding or adding. Positions between +1% and +3% are uncertain – take some profits to lock in gains. Positions at or below +1% have historically shown poor follow-through and should be exited. Remember, this is historical statistical analysis; always apply your own risk management rules and position sizing.
Technical Analysis
XLC’s technical picture presents a mixed outlook as of March 3, 2026. The ETF currently trades at $116.03, positioned between its two key moving average anchors: it sits 0.61% below the 50-day moving average at $116.75 and 2.68% above the 200-day moving average at $113.01. This placement in the “Goldilocks zone” between the two major averages suggests a consolidation phase rather than a strong directional commitment in either direction.
From a longer-term perspective, XLC is performing well within its annual range. Trading 38.10% above its 52-week low of $84.02 and only 3.63% below its 52-week high of $120.41 places the ETF at the 88th percentile of its 12-month range. This elevated position suggests the communication services sector has been in a strong uptrend, though the small gap to all-time highs indicates limited room for explosive expansion without first consolidating or pulling back.
The 3-year average return of 28.95% and the year-to-date return of 32.26% reflect strong performance momentum in the communication services sector. However, the 5-year average return of 9.77% suggests that not all years have been equally robust, indicating cyclicality in the sector. Recent 10-day average volume of 9.69 million shares, compared to the long-term average of 7.30 million, indicates above-average liquidity and investor interest, which is favorable for entry and exit execution.
Traders should monitor XLC’s behavior relative to the $116.75 resistance (50-day moving average). A break above this level combined with volume confirmation could signal the beginning of a new leg higher. Conversely, a move below the $113.01 support (200-day moving average) would suggest a potential break in the current uptrend and warrant defensive positioning.
ETF Overview – Key Metrics
| Metric | Value |
|---|---|
| Current Price | $116.03 |
| Net Assets Under Management | $27.16 Billion |
| Net Expense Ratio | 0.08% |
| Dividend Yield (Forward) | 1.12% |
| Trailing P/E Ratio (TTM) | 18.02x |
| EPS (Trailing Twelve Months) | $6.44 |
| 52-Week High | $120.41 |
| 52-Week Low | $84.02 |
| 50-Day Moving Average | $116.75 |
| 200-Day Moving Average | $113.01 |
| 3-Year Average Return | 28.95% |
| 5-Year Average Return | 9.77% |
| Year-to-Date Return (2026) | 32.26% |
| 3-Month Trailing Return | 2.72% |
| 10-Day Average Volume | 9.69 Million Shares |
| 30-Day Average Volume | 7.30 Million Shares |
| Beta (3-Year) | 0.95 |
Performance History – Long-Term Returns
XLC demonstrates solid long-term performance across multiple timeframes, though with notable variation between periods. The following table shows the ETF’s returns across key measurement windows.
| Time Period | Return | Interpretation |
|---|---|---|
| Year-to-Date (2026) | +32.26% | Exceptional start to 2026. Communication services outperforming broader market. |
| 3-Month Trailing | +2.72% | Modest recent gains. Consolidation after strong earlier gains suggests caution. |
| 3-Year Average Annual | +28.95% | Robust 3-year performance. Sector has been in strong multi-year bull market. |
| 5-Year Average Annual | +9.77% | Solid but more modest. Reflects cyclicality; earlier 2021-2022 period included downturns. |
Volume Analysis
Liquidity is a key strength of XLC. Daily trading volume is robust, which is crucial for traders seeking to enter and exit positions efficiently without significant slippage. The 10-day average volume of 9.69 million shares is 33% above the 30-day average of 7.30 million shares, indicating elevated investor interest in the ETF recently.
This increased activity could reflect growing recognition of the communication services sector’s momentum, driven by strength in telecommunications, streaming media platforms, and interactive entertainment companies. The bid-ask spread at the time of analysis was negligible ($116.01 bid / $116.02 ask), demonstrating tight market pricing and efficient execution for traders.
The absolute volume levels place XLC well within the realm of highly-tradeable ETFs. Institutions and retail traders alike can establish or liquidate multi-million dollar positions without materially moving the price, making XLC suitable for everything from small tactical trades to large core sector allocations. For traders using the signal system outlined in this analysis, the liquidity profile makes position entry and management straightforward and cost-efficient.
Exit Rules & Risk Management
The backtest data for XLC reveals specific exit rules that have historically managed risk effectively while preserving profitable trades:
Primary Exit Rule: Close any position that has not achieved at least 3% performance after 10 days. According to the historical data, positions showing only 0-3% gains in the first 10 days have demonstrated poor follow-through, with the 0-1% range actually turning negative (-1.5%) over 60 days. This rule protects capital from being trapped in slow-moving, unprofitable positions.
Maximum Stoploss Rule: Implement a hard 10% stoploss on all positions. The backtest shows that entries in the -5% to -3% range subsequently declined to -18.1% over 60 days, demonstrating that early weakness can compound. A 10% stoploss prevents catastrophic losses and aligns with prudent portfolio risk management.
Historical Worst-Case Scenario: The maximum observed loss when exiting at either the 10-day close rule or the 10% stoploss has ranged from -0.45% to -10.0%, depending on entry timing and market conditions. This establishes a known maximum risk envelope for position sizing calculations.
For traders applying these rules, position sizing becomes critical. If you can tolerate a 10% maximum loss per position, size your trade accordingly. For example, if you have a $100,000 account and want a $1,000 maximum loss, size your XLC position at approximately $10,000. The combination of the 10-day close rule and 10% stoploss should ideally keep realized losses to a fraction of the theoretical maximum, but this maximum establishes the worst-case boundary for risk planning.
Conclusion
XLC presents an intriguing opportunity for traders and sector allocators seeking exposure to communication services with attractive fundamentals and favorable technical positioning. With $27.2 billion in assets, a minuscule 0.08% expense ratio, and robust daily liquidity, the ETF is the premier vehicle for this sector allocation.
The signal analysis reveals that entries in the +3% to +5% and +5% to +7% ranges have historically demonstrated the strongest follow-through, particularly over 20-60 day horizons where gains of 14-18% have been achievable. The 12.31% edge rating suggests the current market environment may be favorable for tactical positioning, though traders must adhere strictly to the exit rules to manage the inherent risks of sector rotation and macro market cycles.
The ETF’s strong year-to-date performance of 32.26% and 3-year annualized return of 28.95% reflect genuine sector strength driven by structural trends in telecommunications infrastructure, digital media consumption, and entertainment streaming. However, the modest 3-month trailing return of 2.72% suggests momentum may be moderating, making the discipline of the signal system even more critical for capital preservation.
Traders should use the Day 10 Decision Guide as their primary framework: positions achieving 3%+ gains should be held or added to, while positions below 3% should be closed to redeploy capital into more cooperative positions. Combined with the 10% stoploss rule and appropriate position sizing, this mechanical approach should remove emotion from trading decisions and improve long-term results.
For more signals visit stockbotty.com | Disclaimer: stockbotty.com/disclaimer
More Exchange Traded Funds - Signals Articles
QQQ Signal Follow-Up: -1.03% After 10 Days | Exit Triggered
QQQ Signal Follow-Up - 10 Days Review: -1.03% Performance Executive Summary On August 10, 2026, a...
Aug 22, 2026PLTM Signal Follow-Up: 10 Days +7.31% Performance Review
PLTM Signal Follow-Up: 10 Days Review — +7.31% Performance Executive Summary On August 10, ...
Aug 22, 2026GLD Signal Follow-Up +4.21% in 10 Days: Hold Decision
GLD Signal Follow-Up - 10 Days Review: +4.21% Performance Executive Summary A trendchange signal ...
Aug 21, 2026SIL Signal Follow-Up: +10.15% at 10 Days – Hold Status
SIL Signal Follow-Up - 10 Days Review: +10.15% Performance Executive Summary A trendchange signal...
Aug 21, 2026XLK Signal Review: -2.59% After 10 Days, Exit Triggered
XLK Signal Follow-Up - 10 Days Review: -2.59% Performance Executive Summary XLK triggered a trend...
Aug 21, 2026