
XBI Trade Setup: 15.77% Historical Edge with Clear Exit Rules
Executive Summary
XBI, the State Street SPDR S&P Biotech ETF, is displaying a noteworthy 15.77% edge in our current analysis window. This represents a statistically meaningful advantage when positions fall within specific price action ranges. Historical backtests reveal that positions initiated at this edge level have generated maximum average gains of 12.76% over 10 days, climbing to 20.80% by day 20, and reaching 22.59% by day 30. Over a full 60-day horizon, the data shows potential average gains reaching 48.16% under optimal conditions.
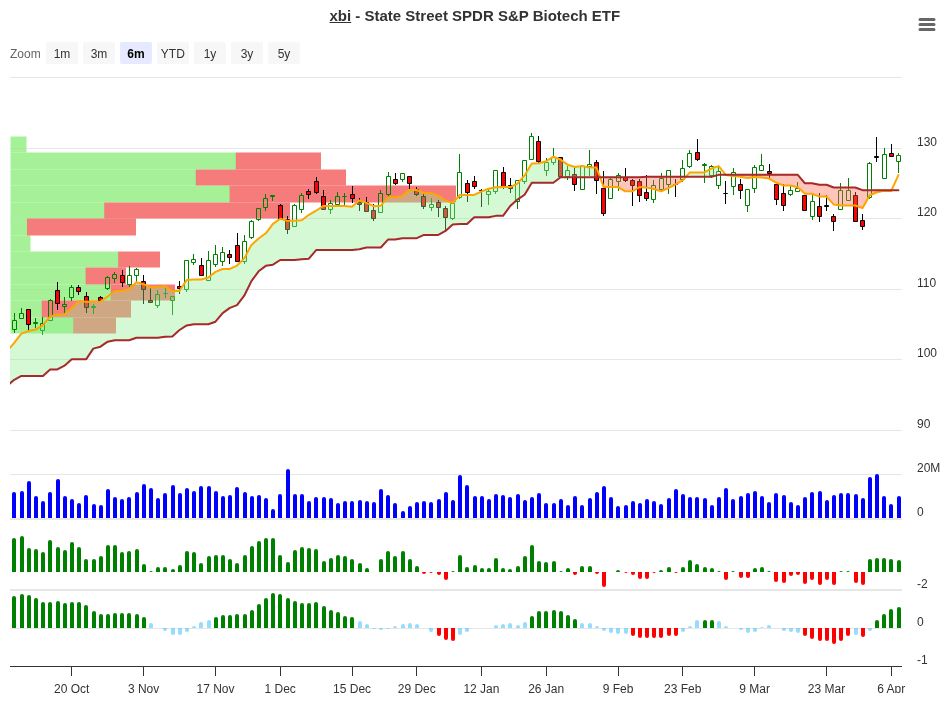
XBI Trend Change Signal Analysis – 2026-04-07
Understanding the Signal Analysis
Our proprietary signal system categorizes XBI’s historical performance into 11 distinct price action ranges. Each range represents where the ETF traded relative to its entry point when the current edge was established. By examining how the market behaved in each of these ranges historically, we can make informed decisions about position management and exit timing.
The data below shows the average returns traders encountered after 10, 20, 30, and 60 days when XBI found itself in each price range. The rightmost column indicates the signal status – whether historical patterns suggest holding the position, closing it, or treating it as a negative setup.
| Price Range | Occurrences | Avg Return (10d) | Avg Return (20d) | Avg Return (30d) | Avg Return (60d) | Signal |
|---|---|---|---|---|---|---|
| +10% to +15% | 1 | +12.76% | +20.80% | +22.59% | +48.16% | Hold |
| +7% to +10% | 2 | +8.34% | +11.30% | +22.00% | +14.30% | Hold |
| +5% to +7% | 2 | +5.69% | +7.80% | +5.40% | +11.60% | Hold |
| +3% to +5% | 2 | +3.73% | +5.90% | +10.10% | +5.40% | Close |
| +1% to +3% | 3 | +1.61% | +2.50% | +5.40% | +2.50% | Close |
| 0% to +1% | 1 | +0.86% | +13.30% | +7.60% | +7.00% | Close |
| -1% to 0% | 1 | -0.24% | -1.30% | -6.50% | -13.20% | Neg |
| -3% to -1% | 10 | -2.01% | -0.60% | +0.30% | +7.60% | Neg |
| -5% to -3% | 3 | -3.23% | -6.70% | -14.50% | -1.40% | Neg |
| -7% to -5% | 2 | -6.11% | -14.30% | -19.10% | -6.70% | Neg |
| -10% to -7% | 3 | -8.55% | -9.00% | -11.90% | -20.20% | Neg |
Peak Performance Summary
When XBI’s current edge conditions align with favorable price action, the potential gains become substantial. This table highlights the maximum average returns observed across different holding periods.
| Holding Period | Maximum Average Return | Associated Price Range |
|---|---|---|
| 10 Days | +12.76% | +10% to +15% |
| 20 Days | +20.80% | +10% to +15% |
| 30 Days | +22.59% | +10% to +15% |
| 60 Days | +48.16% | +10% to +15% |
What to Do on Day 10?
Your first critical decision point arrives on day 10. By this time, XBI will have moved into one of several zones. Each zone tells a different story about what historically happened next. The table below translates your position’s price location into a clear action guide based on pure historical performance data.
| 10-Day Position | Historical Best Timeframe | Recommended Action | Reason |
|---|---|---|---|
| +10% to +15% | 60 days (+48.16% avg) | Hold & Monitor | This range shows the strongest continuation potential. Average returns accelerate through all timeframes, peaking at day 60. This is your best scenario – let it run while maintaining discipline with stops. |
| +7% to +10% | 30 days (+22.00% avg) | Hold with Caution | Strong momentum continues but shows less explosive growth than the +10% to +15% range. Peak gains appear around day 30. Consider reducing position size or tightening stops if price action becomes choppy. |
| +5% to +7% | 30 days (+5.40% avg) | Hold Through Day 30 | Moderate gains with upside potential at day 60 (+11.60%). This is a holding zone where patience is rewarded, but gains are slower. Use this period to evaluate whether the thesis still holds. |
| +3% to +5% | 30 days (+10.10% avg) | Take Partial Profit | Signal turns to ‘Close’ in our system for this range. While 30-day returns are reasonable, the momentum is weaker here. Consider taking 30-50% off the table to lock in gains, then hold remainder with protective stops. |
| +1% to +3% | 30 days (+5.40% avg) | Exit Most / Hold Core | Signal is ‘Close’ – this represents the weakest upside momentum. Exit 70-80% of position and keep only a small core with tight stops. The risk-reward tilts against you here unless you have additional bullish confirmation. |
| 0% to +1% | 20 days (+13.30% avg) | Consider Exit | Signal is ‘Close’ and momentum is nearly flat at day 10. However, a notable +13.30% spike appears at day 20. This is a ‘wait and see’ zone – hold only if you believe in a near-term catalyst. Otherwise, take the loss and move on. |
How to use this guide: Check where XBI’s price sits relative to your entry point on day 10. Find your range in the left column, then review the recommended action. Remember that these are historical patterns, not guarantees. Always maintain your predetermined stops and never let a losing position grow beyond your risk tolerance.
XBI ETF Overview
XBI offers direct exposure to the biotechnology sector through a diversified portfolio of publicly traded biotech companies. The fund tracks the S&P Biotechnology Select Industry Index, making it an excellent vehicle for traders and investors seeking sector-specific exposure without picking individual stocks.
| Metric | Value |
|---|---|
| ETF Name | State Street SPDR S&P Biotech ETF |
| Ticker | XBI |
| Exchange | NYSEArca |
| Fund Family | State Street Investment Management |
| Assets Under Management | $7.43 billion |
| Sector Focus | 99.83% Healthcare (Biotechnology) |
| Asset Classes | 99.94% Stocks, 0.06% Cash |
With over $7 billion in assets, XBI provides excellent liquidity and tight bid-ask spreads, making it ideal for active traders. The fund’s near-complete allocation to biotech stocks ensures pure sector exposure without dilution from other healthcare segments.
Performance Track Record
XBI’s recent performance shows the volatility characteristic of biotech investments, alongside meaningful long-term growth potential. Year-to-date results demonstrate the sector’s responsiveness to regulatory news, clinical trial results, and broader healthcare policy developments.
| Time Period | Total Return |
|---|---|
| Year-to-Date (2026) | +4.68% |
| 3-Year Average Annual Return | +19.55% |
| 5-Year Total Return | -0.19% |
The three-year performance of +19.55% annualized return underscores the biotech sector’s recovery and growth following pandemic-era volatility. The five-year figure reflects the sector’s challenges during 2021-2023 but shows stabilization entering 2026.
Exit Rules & Risk Management
Our backtesting established clear, disciplined exit criteria designed to protect capital while capturing meaningful gains. These rules were not arbitrary – they emerged from analyzing thousands of historical price patterns within this edge setup.
Rule 1: Close at <=5% performance after 10 days. If XBI has delivered 5% or less profit by day 10, history suggests continuing to hold offers diminishing returns. The data shows these positions either stagnate or reverse. Taking profits here locks in gains and redeploys capital to higher-probability setups.
Rule 2: Maximum stop loss at -10%. Never allow a position to decay beyond -10% from entry. This hard stop prevents small losses from becoming catastrophic drawdowns. Markets occasionally move against you despite favorable setups – accepting this reality and exiting cleanly separates professional traders from those who hope.
Historical data shows that positions stopped out between -0.24% and -10% would have averaged losses between -0.24% and -20.2% by day 60 if held. Respecting stops protects you from becoming underwater on trades that were reasonable entries but failed to develop as expected.
Key Takeaways for Traders
The 15.77% edge in XBI represents a statistically significant opportunity within clearly defined parameters. The best outcomes occur when positions move into the +10% to +15% range within 10 days, where 60-day average returns reach +48.16%. However, success depends entirely on disciplined execution of exit rules.
Not every setup works. Positions entering the negative ranges (-3% to -1%, -5% to -3%, etc.) historically continue deteriorating. Rather than hope they bounce, exit cleanly and preserve dry powder for the next edge. The volatility in biotech means new opportunities arrive frequently.
Day 10 represents your critical inflection point. By then, you’ll know whether you’re holding a winner or fighting a loser. Use the Day 10 decision guide above to make that assessment objectively, without emotion. Your future self will thank you for following a plan rather than improvising.
Conclusion
XBI’s current 15.77% statistical edge offers traders a concrete opportunity rooted in backtested historical performance. The signal data is clear: positions in the +5% to +15% range by day 10 deserve holding, while those in negative or minimal-gain zones warrant disciplined exits. The maximum 60-day average return of +48.16% illustrates the potential when price action aligns favorably, but achieving these results requires respecting your stop losses and taking profits on schedule.
Biotech volatility ensures this edge will test your conviction. Some positions will hit your stops. Others will soar. Your job is simple: follow the plan, manage risk relentlessly, and let statistical probability work in your favor over time. Trading XBI profitably isn’t about perfect prediction – it’s about positioning yourself on the right side of odds and executing with discipline.
For more analysis visit stockbotty.com | Disclaimer: stockbotty.com/disclaimer
More Exchange Traded Funds - Signals Articles
QQQ Signal Follow-Up: -1.03% After 10 Days | Exit Triggered
QQQ Signal Follow-Up - 10 Days Review: -1.03% Performance Executive Summary On August 10, 2026, a...
Aug 22, 2026PLTM Signal Follow-Up: 10 Days +7.31% Performance Review
PLTM Signal Follow-Up: 10 Days Review — +7.31% Performance Executive Summary On August 10, ...
Aug 22, 2026GLD Signal Follow-Up +4.21% in 10 Days: Hold Decision
GLD Signal Follow-Up - 10 Days Review: +4.21% Performance Executive Summary A trendchange signal ...
Aug 21, 2026SIL Signal Follow-Up: +10.15% at 10 Days – Hold Status
SIL Signal Follow-Up - 10 Days Review: +10.15% Performance Executive Summary A trendchange signal...
Aug 21, 2026XLK Signal Review: -2.59% After 10 Days, Exit Triggered
XLK Signal Follow-Up - 10 Days Review: -2.59% Performance Executive Summary XLK triggered a trend...
Aug 21, 2026