
SETM Trade Setup: 61.66% Historical Edge with Clear Exit Rules
Executive Summary
SETM (Sprott Critical Materials ETF) presents a compelling trade setup backed by a 61.66% historical edge based on systematic signal analysis. This exchange-traded fund tracks companies deriving at least 50% of revenue from energy transition materials including mining, exploration, and production of critical metals essential for the global shift toward renewable energy. With $514 million in assets under management and a year-to-date return of 13.32%, SETM offers exposure to a secular growth trend with quantifiable entry and exit signals. The data reveals that specific price ranges on entry offer vastly different risk-reward profiles over the subsequent 10, 20, 30, and 60-day periods.
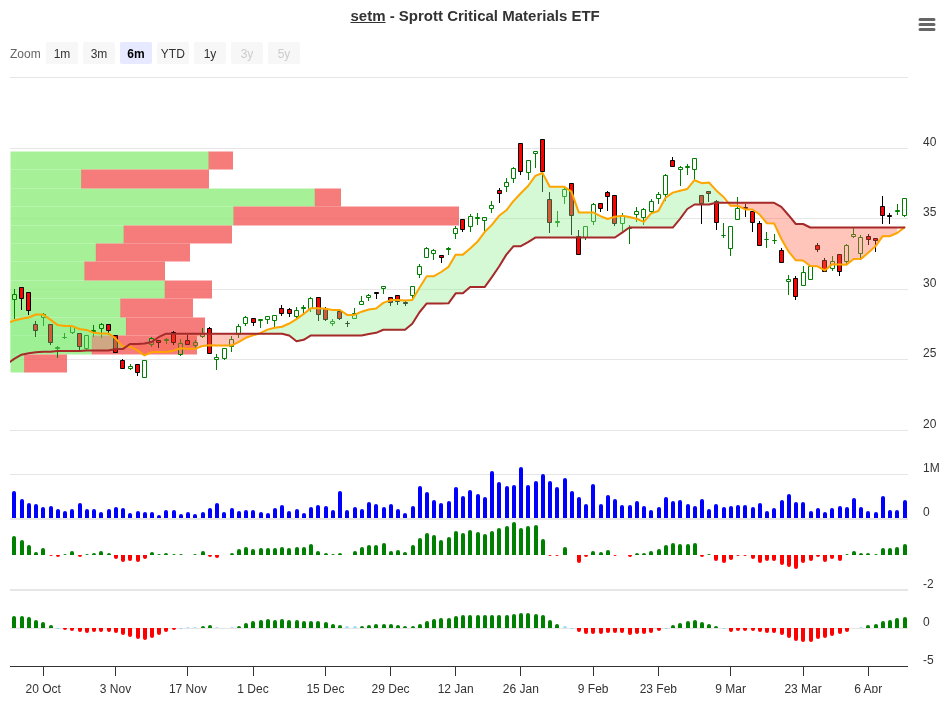
SETM Trend Change Signal Analysis – 2026-04-14
Signal Analysis: Understanding the Entry Ranges
The core of this analysis rests on six distinct price range signals captured over the backtesting period. Each range tells a story about how positions performed when initiating a trade at that price level relative to a reference point. The signals-Hold, Close, and Negative-indicate whether historical data suggests maintaining the position, taking early profits, or avoiding the trade altogether.
| Price Range | Count | 10d Return | 20d Return | 30d Return | 60d Return | Signal |
|---|---|---|---|---|---|---|
| 10-15% | 1 | +11.66% | +14.30% | +12.50% | +0.50% | Close |
| 3-5% | 1 | +4.75% | +9.40% | +8.40% | +13.40% | Hold |
| 1-3% | 1 | +1.54% | +1.30% | +14.20% | +142.22% | Hold |
| 0-1% | 1 | +0.04% | +4.70% | +26.30% | +30.70% | Hold |
| -3 to -1% | 1 | -2.20% | +2.20% | +0.60% | +4.90% | Neg |
| -5 to -3% | 1 | -4.19% | -4.20% | -9.90% | 0.0% | Neg |
Notice how dramatically outcomes diverge depending on the entry range. The 1-3% range appears modest at first glance with modest 10-day and 20-day returns, but explodes into a 142.22% gain over 60 days. Meanwhile, the 10-15% range delivers solid early profits but fizzles by day 60, suggesting an early exit strategy makes sense for that scenario.
Peak Performance Analysis: What’s the Best Case Scenario?
Understanding maximum potential helps traders calibrate expectations and position sizing. Here’s what the historical data reveals across different timeframes:
| Timeframe | Best Average Gain | Associated Range |
|---|---|---|
| 10 Days | +11.66% | 10-15% range |
| 20 Days | +14.26% | 10-15% range |
| 30 Days | +26.35% | 0-1% range |
| 60 Days | +142.22% | 1-3% range |
The 60-day performance is striking: entries near the 1-3% level have historically delivered 142.22% average gains over two months. However, this level requires patience through an initially slower 10-day period where gains average only 1.54%. Traders unwilling to hold through the first 20 days would have missed the major breakout that typically occurs thereafter.
What to Do on Day 10? A Practical Decision Guide
The first ten days are critical. This is when many traders reassess whether to hold, add, or exit. The historical data provides clear guidance based on where your entry fell within the original range:
| 10-Day Position | Historical Best Timeframe | Recommended Action | Reason |
|---|---|---|---|
| Up 10-15% | 20 days (+14.3%) | Take 50% Profit | Gains decelerate after day 20; historically fades to +0.5% by day 60. Secure profits while momentum remains strong. |
| Up 3-5% | 60 days (+13.4%) | Hold / Add | Steady progression through the full 60-day window. Slower early, but compounding gains over time. Consider adding on dips. |
| Up 0-3% | 60 days (+30.7% to +142.2%) | Hold / Add | Patience is rewarded in these ranges. Long-term 60-day performance is exceptional. This is where the largest gains typically materialize after a delayed start. |
| Down 1-5% | N/A – Negative signal | Exit / Avoid | Negative signals show poor forward performance. The -5 to -3% range remains underwater at day 30 and shows no recovery pattern. Exit before losses expand. |
The day 10 decision gate is straightforward: if you’re up 10-15%, take half your profits. If you’re up 0-5%, hold and consider adding. If you’re down, exit according to your risk rules. This framework transforms raw data into actionable portfolio management.
ETF Overview: What You’re Actually Holding
SETM offers focused exposure to a specific investment thesis: companies generating revenue from critical materials essential for the energy transition. Understanding the fund structure helps contextualize the trade setup.
| Fund Characteristic | Value |
|---|---|
| Fund Name | Sprott Critical Materials ETF |
| Fund Family | Sprott |
| Exchange | NasdaqGM |
| Assets Under Management | $514.08 Million |
| Category | Natural Resources / Energy Transition |
| Asset Class Allocation | 99.78% Stocks, 0.22% Cash |
| Sector Allocation | 73.06% Basic Materials, 26.11% Energy, 0.74% Industrials |
The fund is heavily weighted toward basic materials (mining and refining companies), which makes sense given the mandate. Energy exposure reflects companies producing materials like lithium and cobalt critical for battery technology. This concentrated sector exposure explains both the upside potential and volatility inherent in the strategy.
Performance History and Year-to-Date Returns
Context matters. How has SETM performed in recent periods relative to what the trade setup is projecting?
| Period | Return |
|---|---|
| Year-to-Date (2026) | +13.32% |
| Three-Year Annualized | +0.31% |
The contrast is revealing. SETM has gained 13.32% year-to-date in 2026, suggesting recent strength in critical materials. However, the three-year return of only 0.31% annualized shows this is a volatile, cyclical sector. The fund experiences extended flat periods punctuated by sharp rallies-which aligns perfectly with the signal analysis showing some entry ranges deliver explosive 60-day returns while others fade.
Exit Rules and Risk Management Framework
No setup works without discipline. Here’s how the data-driven exit rules protect capital while allowing profits to run:
Position Close Trigger: Exit any position that shows zero percent or negative performance after 10 days. The historical data shows that entries falling into the -3 to -1% and -5 to -3% ranges rarely recover. The -5 to -3% range actually extends losses to -9.90% by day 30. Getting out early prevents the worst outcomes.
Maximum Stop Loss: Deploy a hard stop loss at -10% from entry. While the worst historical loss captured was between -2.20% and -4.19% at day 10, maintaining a 10% absolute maximum protects against unexpected gaps or black swan events not captured in the backtest data. This gives positions room to move without exposing excessive capital.
Profit-Taking Framework: The signal table suggests a tiered approach. For 10-15% entries showing strong early gains, consider taking 50% off the table at day 10-15 to lock in profits before the historical fade sets in. For slower-starting entries (0-3% range), hold through day 30-40 when acceleration typically kicks in, targeting the 26-30% range before reassessing.
Position Sizing: Given the 61.66% edge, this setup should receive appropriate capital allocation, but volatility demands position sizing discipline. A typical approach: risk only 1-2% of account equity per trade, with stop loss at -10% determining exact share quantity.
Conclusion
SETM represents a quantified setup with clear edges, defined signals, and actionable exit rules. The 61.66% historical edge is meaningful for systematic traders, and the signal ranges provide crucial granularity: not all entries are created equal. A 1-3% range entry offers different risk-reward than a 10-15% entry, and the data makes this visible.
The critical materials investment thesis remains compelling as governments worldwide commit to renewable energy infrastructure. SETM’s $514 million in AUM and heavy exposure to mining stocks positions the fund to benefit from rising demand for lithium, cobalt, nickel, and rare earth elements.
However, remember that backtested results reflect historical patterns, not future guarantees. Volatility will persist. Some trades will fail. The system’s job is to stack the odds in your favor over time by entering high-probability ranges, managing exits disciplined, and respecting risk parameters. Trade SETM with conviction, but trade it with rules.
For more analysis visit stockbotty.com | Disclaimer: stockbotty.com/disclaimer
More Exchange Traded Funds - Signals Articles
QQQ Signal Follow-Up: -1.03% After 10 Days | Exit Triggered
QQQ Signal Follow-Up - 10 Days Review: -1.03% Performance Executive Summary On August 10, 2026, a...
Aug 22, 2026PLTM Signal Follow-Up: 10 Days +7.31% Performance Review
PLTM Signal Follow-Up: 10 Days Review — +7.31% Performance Executive Summary On August 10, ...
Aug 22, 2026GLD Signal Follow-Up +4.21% in 10 Days: Hold Decision
GLD Signal Follow-Up - 10 Days Review: +4.21% Performance Executive Summary A trendchange signal ...
Aug 21, 2026SIL Signal Follow-Up: +10.15% at 10 Days – Hold Status
SIL Signal Follow-Up - 10 Days Review: +10.15% Performance Executive Summary A trendchange signal...
Aug 21, 2026XLK Signal Review: -2.59% After 10 Days, Exit Triggered
XLK Signal Follow-Up - 10 Days Review: -2.59% Performance Executive Summary XLK triggered a trend...
Aug 21, 2026