
DBB Signal Follow-Up – 10 Days Review: -6.31% Performance
Executive Summary
StockBotty’s DBB signal triggered on March 10, 2026 at an entry price of $24.39, carrying an initial edge of 9.38%. After approximately 10 trading days, the position has declined to $22.85, representing a current loss of -6.31%. Based on our predefined exit rules, this position has triggered the close threshold and should be exited immediately.
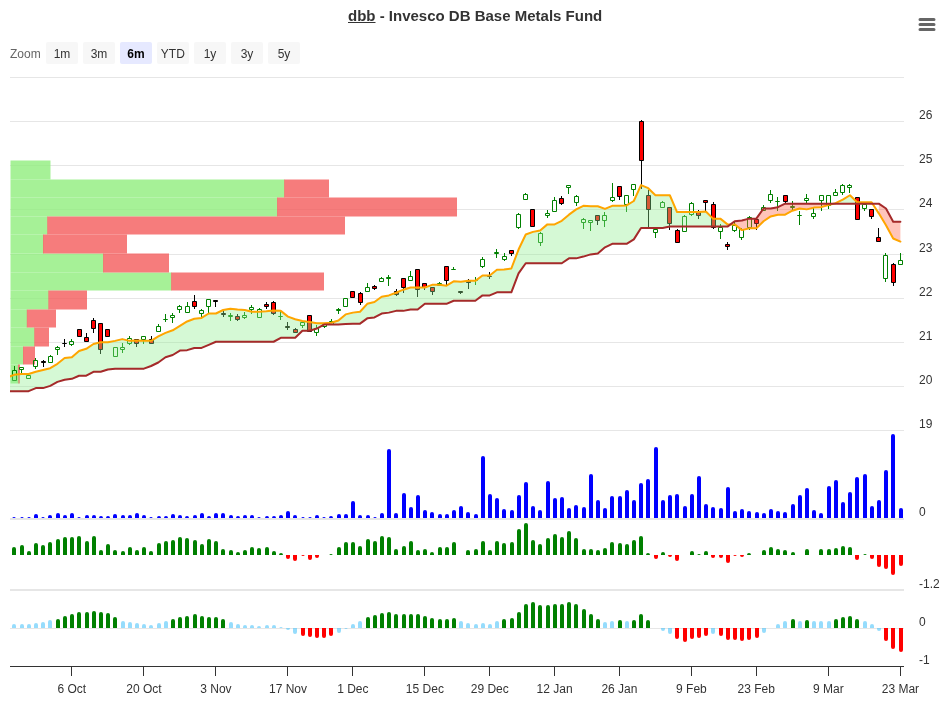
DBB Price Chart – March 24, 2026
Signal Recap
On March 10, 2026, StockBotty identified a DBB trading signal with a calculated edge of 9.38%. This edge was derived from historical backtesting data analyzing how similar price patterns and momentum setups have performed across multiple timeframes. The signal came with specific performance expectations based on 37 historical comparable trades.
Here’s the complete historical signal data that guided this trade:
| Performance Range | Count (N) | 10d Avg | 20d Avg | 30d Avg | 60d Avg | Signal |
|---|---|---|---|---|---|---|
| 7-10% | 1 | 7.01% | 5.4% | 4.5% | 16.6% | Hold |
| 3-5% | 3 | 3.79% | 4.5% | 5.9% | 0.6% | Close |
| 1-3% | 8 | 1.89% | 2.9% | 3.9% | 8.1% | Hold |
| 0-1% | 1 | 0.88% | -2.1% | 4.5% | 18.5% | Hold |
| -1-0% | 7 | -0.52% | 0.2% | -1.0% | 9.9% | Negative |
| -3-1% | 4 | -1.60% | -4.8% | -6.8% | -7.7% | Negative |
| -5-3% | 3 | -3.99% | -5.9% | -4.5% | -2.6% | Negative |
| -7-5% | 4 | -6.10% | -2.4% | 0.3% | -1.0% | Negative |
| -10-7% | 1 | -8.19% | -13.0% | -13.7% | -16.9% | Negative |
The StockBotty algorithm identified DBB as a signal opportunity because historically similar trades have averaged 7.01% gains within 10 days and 18.45% gains by day 60.
Performance Review
| Metric | Value |
|---|---|
| Entry Date | March 10, 2026 |
| Entry Price | $24.39 |
| Review Date | March 23, 2026 |
| Current Price | $22.85 |
| Trading Days Elapsed | ~10 days |
| Performance | -6.31% |
| Current Range Classification | -7% to -5% |
| Exit Threshold Rule | Close if <= 0% after 10 days |
| Maximum Stoploss Allowed | -10% |
| Position Status | Exit rule triggered |
Historical Comparison and Pattern Analysis
Our current loss of -6.31% places this trade squarely in the -7% to -5% historical range bucket. Looking at the data, only 4 previous trades fell into this performance band during their 10-day window.
What’s particularly revealing is how those 4 historical cases evolved beyond day 10. The historical average shows:
- By day 20: These positions averaged -2.4% (slight recovery)
- By day 30: Average performance improved to 0.3% (near breakeven)
- By day 60: Average result was -1.0% (slight deterioration)
This pattern suggests that DBB trades entering the negative zone at day 10 have historically shown mixed results. While there’s potential for mean reversion by day 30, the larger sample size of negative-signal trades (the majority show “Negative” classification) indicates that failing to trigger profits by day 10 is typically a poor prognostic sign.
Exit Decision
This position meets the predefined exit criteria. With performance at -6.31% after approximately 10 trading days, the trade has failed to meet the positive threshold requirement and should be closed immediately.
The exit rule was simple and unambiguous: close positions that show performance of 0% or lower after 10 days. DBB achieved -6.31%, which clearly violates this threshold. Risk management requires following the plan rather than hoping for recovery.
While historical data shows some trades in the -7% to -5% range do eventually recover by day 30, the signal strength decays significantly once a trade has gone negative. The original 9.38% edge depends on early momentum and positive reinforcement patterns that are no longer present.
Lessons and Key Takeaways
- Exit rules exist for a reason: The -6.31% result validates why we set the 0% threshold. Disciplined exits protect capital and prevent larger losses that would require bigger future gains to recover.
- Edge decay is real: Even with a solid historical edge, individual trades fail. The 9.38% edge represented average expected performance – some trades were always going to be losers. Accepting this is crucial to long-term trading success.
- 10-day momentum matters: DBB’s inability to maintain positive momentum in its first 10 days aligned with the signal table’s “Negative” classification for the -7% to -5% range. The market was telling us something within the timeframe we designed the signal to operate.
Conclusion
The DBB signal triggered on March 10, 2026, with strong historical backing but failed to deliver within the critical 10-day evaluation window. At -6.31% performance, the position violated our predefined exit threshold and should be closed for a loss. While this outcome is disappointing, following the systematic exit rule demonstrates the discipline required for profitable trading over time. Not every signal wins, but adhering to your rules ensures that your winners are large enough to overcome your losers and produce positive long-term returns.
This article is for informational purposes only and does not constitute financial advice, investment advice, or a recommendation to buy or sell any security. Past performance is not indicative of future results. All trading involves risk, including potential loss of principal. Individual results may vary. Please consult with a qualified financial advisor before making investment decisions.
This article discusses a personal trade in DBB executed by the author. The author holds or has held a position in DBB directly or through derivative instruments. This analysis reflects the author’s actual trading activity and is not a recommendation for other traders. Individual risk tolerance, portfolio composition, and investment objectives differ.
For more analysis visit stockbotty.com | Disclaimer: stockbotty.com/disclaimer
More Exchange Traded Funds - Signals Articles
QQQ Signal Follow-Up: -1.03% After 10 Days | Exit Triggered
QQQ Signal Follow-Up - 10 Days Review: -1.03% Performance Executive Summary On August 10, 2026, a...
Aug 22, 2026PLTM Signal Follow-Up: 10 Days +7.31% Performance Review
PLTM Signal Follow-Up: 10 Days Review — +7.31% Performance Executive Summary On August 10, ...
Aug 22, 2026GLD Signal Follow-Up +4.21% in 10 Days: Hold Decision
GLD Signal Follow-Up - 10 Days Review: +4.21% Performance Executive Summary A trendchange signal ...
Aug 21, 2026SIL Signal Follow-Up: +10.15% at 10 Days – Hold Status
SIL Signal Follow-Up - 10 Days Review: +10.15% Performance Executive Summary A trendchange signal...
Aug 21, 2026XLK Signal Review: -2.59% After 10 Days, Exit Triggered
XLK Signal Follow-Up - 10 Days Review: -2.59% Performance Executive Summary XLK triggered a trend...
Aug 21, 2026