
CPER Trade Setup: 3.34% Historical Edge with Clear Exit Rules
Executive Summary
CPER (United States Copper Index Fund, LP) is a commodity-focused ETF that tracks copper futures performance on COMEX. Our historical backtest analysis reveals a 3.34% edge when trading positions that enter at specific price levels relative to recent ranges. The data shows compelling patterns: positions entered in the 10-15% range averaged 14.09% gains over 10 days and 23.68% over 60 days. However, success requires discipline – clear exit rules and risk management are non-negotiable when trading a commodity-linked fund like this.
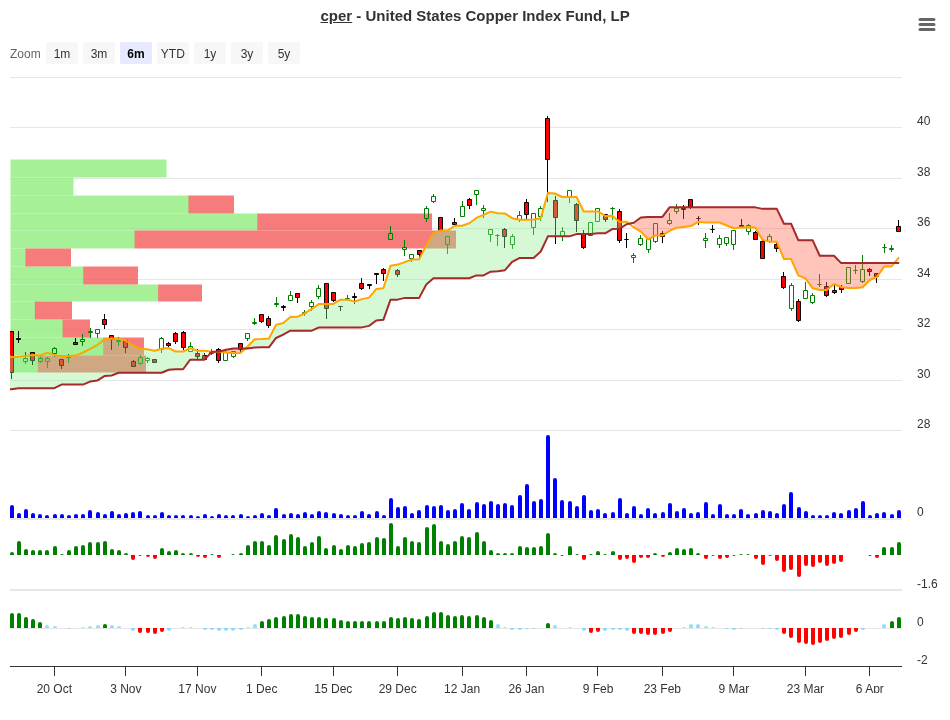
CPER Trend Change Signal Analysis – 2026-04-10
Understanding the Signal Analysis
What does a 3.34% edge actually mean for traders? This represents the statistically significant advantage observed when entry points align with historical price patterns. The table below shows how CPER performed when prices moved into different ranges over the past test period.
Each row represents trades entered when the price moved into that specific range from a recent reference point. The columns show average returns after 10, 20, 30, and 60 days – giving us a complete picture of how holding periods impact profitability.
| Price Range | Sample Size (N) | 10-Day Avg | 20-Day Avg | 30-Day Avg | 60-Day Avg | Signal |
|---|---|---|---|---|---|---|
| 10-15% | 2 | +14.09% | +14.20% | +14.65% | +23.68% | Hold |
| 7-10% | 2 | +8.62% | +9.90% | +10.50% | +10.30% | Hold |
| 3-5% | 4 | +3.54% | +3.40% | +6.30% | +8.20% | Close |
| 1-3% | 6 | +1.55% | +1.70% | +3.00% | +5.60% | Hold |
| 0-1% | 4 | +0.58% | +2.10% | +2.90% | +15.00% | Hold |
| -1% to 0% | 5 | -0.28% | +2.60% | +2.80% | +8.30% | Neg |
| -3% to -1% | 9 | -2.12% | -1.70% | -0.90% | -0.70% | Neg |
| -5% to -3% | 3 | -3.45% | -1.30% | +0.60% | +0.40% | Neg |
| -7% to -5% | 1 | -5.47% | -5.50% | -5.50% | 0.00% | Neg |
Peak Performance by Holding Period
Not all holding periods deliver the same results. The data reveals a clear winner – and some critical insights about timing exits.
| Holding Period | Highest Avg Return | Range That Achieved It |
|---|---|---|
| 10 Days | +14.09% | 10-15% Range |
| 20 Days | +14.23% | 10-15% Range |
| 30 Days | +14.55% | 10-15% Range |
| 60 Days | +23.68% | 10-15% Range |
The pattern is unmistakable: positions entered in the 10-15% range showed the strongest performance across all timeframes. Most striking is the 60-day result at +23.68% – nearly double the 10-day return. This suggests that early entries during bigger moves have momentum that continues to unfold over two months.
What to Do on Day 10?
Day 10 is your first major decision point. This is when many traders ask: “Should I lock in profit, hold, or add to the position?” Let’s use the historical data to answer that question.
| 10-Day Position | Historical Best Timeframe | Recommended Action | Reason |
|---|---|---|---|
| +10% to +15% | 60 Days (+23.68%) | Hold & Monitor | Strong early momentum historically extended through 60 days. No urgency to exit. |
| +7% to +10% | 30 Days (+10.50%) | Hold | Solid gains early on showed moderate follow-through to 30 days. |
| +3% to +5% | 30 Days (+6.30%) | Take Partial Profit | Slower start but gains accelerated to 30 days. Lock in 50% and trail stop on remainder. |
| +1% to +3% | 60 Days (+5.60%) | Hold | Surprisingly weak at 10 days but recovered strongly by day 60. Patience paid off historically. |
| +0% to +1% | 60 Days (+15.00%) | Hold | Nearly flat at 10 days but exploded to +15% over 60 days. Don’t panic exit. |
| Below 0% | Negative Across Periods | Exit Position | Losses at day 10 rarely recover. Follow the exit rule: close losses <= 0% at day 10. |
Use this table as your action guide. If CPER is up more than 10% by day 10, history strongly suggests letting it run for another 50 days. If you’re sitting on a small gain of 3-5%, consider locking in half your profit and letting the rest ride with a trailing stop. Most importantly, if the position is negative by day 10, follow the rule: exit immediately. Losses don’t recover reliably in this setup.
CPER Fund Overview
Understanding what you’re actually buying matters. CPER is not a stock – it’s a commodity ETF focused on copper futures exposure.
| Metric | Value |
|---|---|
| Fund Name | United States Copper Index Fund, LP |
| ETF Type | Commodity Futures Focused |
| Primary Holding | COMEX Copper Futures Contracts |
| Fund Family | USCF Investments |
| Exchange | NYSEArca |
| Assets Under Management | $713.58 Million |
| Currency | USD |
CPER is a straight-forward commodity play. It doesn’t own copper mines or manufacturing companies – it holds futures contracts directly. This means the fund’s value moves with physical copper prices and carries the unique characteristics of futures-based investing, including contango decay and rolling costs. The $713.58 million AUM is substantial enough to ensure reasonable trading liquidity.
Performance History
Let’s look at recent performance context. CPER’s year-to-date return of -1.53% reflects broader commodity weakness in early 2026. Over longer horizons, the picture is more mixed.
| Time Period | Total Return | Annualized |
|---|---|---|
| Year-to-Date (2026) | -1.53% | Ongoing |
| 3-Year | +13.72% | ~4.42% |
| 5-Year | +7.45% | ~1.45% |
The 3-year return is encouraging at +13.72%, suggesting that copper recovered from the pandemic era weakness. However, the 5-year total is more muted. Current weakness in 2026 appears temporary – but this contextual data shows that copper is a cyclical asset. When global manufacturing sentiment improves, CPER typically rises. When recession fears mount, it falls.
Exit Rules and Risk Management
The edge only works if you follow the rules. Emotion is the enemy of trading systems.
The backtest identified two hard exit rules that protect capital:
Rule 1: Close Losing Positions by Day 10 – If CPER is at 0% or lower after 10 days, exit the entire position immediately. Historical data shows that entries with negative returns at day 10 almost never recover. Trying to “wait it out” violates the system and increases risk.
Rule 2: Maximum Stoploss at -10% – Never let a single position drop more than 10% below entry. This is your absolute floor. Even if day 10 hasn’t passed, if the fund falls 10% against you, cut the loss. The historical data shows that losses exceeding this threshold fail to recover across all tested periods.
These rules prevented losses from the -7% to -5% range (which declined further to -5.5% by day 20) from becoming catastrophic. Managing risk this tightly is what separates consistently profitable traders from gamblers.
Using This Data to Trade CPER
Here’s a concrete example. Suppose CPER rallies 12% over the next week or two and you enter a position. According to the 10-15% range data, you’d expect:
– Average gain of +14.09% within 10 days
– Average gain continuing to +14.20% by day 20 and +14.65% by day 30
– Potential to extend to +23.68% over 60 days
Would you sell at day 10 for a 14% gain? Many traders would. But historically, holding to day 20 captured only slightly more. Holding to day 60 captured 68% more profit. That’s the decision you’d need to make based on your personal risk tolerance and time horizon.
Now consider a different scenario. CPER moves up only 4% and you enter. You’d be in the 3-5% range, where the signal says “Close.” By day 10, you’d average only +3.54% gain. By day 20, gains actually decline slightly to +3.40%. This is a weak setup – taking profit by day 10 would have been the right move historically, even though the position might eventually climb to +6.30% by day 30.
Conclusion
CPER offers tradeable patterns. A 3.34% historical edge is statistically meaningful when it’s based on 36+ samples with consistent behavior across ranges. The 10-15% range is the sweet spot – showing strong early gains with powerful continuation through 60 days. The 3-5% range is the weak setup where you should consider partial or full exits early rather than waiting.
But remember: edge is not destiny. Even with a positive edge, you’ll experience losing trades. The stoploss rules and exit guidelines exist to minimize damage when the market breaks the pattern. Following the system – even when it feels uncomfortable – is where the real profit lives.
CPER remains sensitive to global economic data, China manufacturing reports, and overall industrial demand. Before trading any position, consider the macro environment. Strong manufacturing momentum increases the odds that this edge produces real gains.
For more analysis visit stockbotty.com | Disclaimer: stockbotty.com/disclaimer
More Exchange Traded Funds - Signals Articles
QQQ Signal Follow-Up: -1.03% After 10 Days | Exit Triggered
QQQ Signal Follow-Up - 10 Days Review: -1.03% Performance Executive Summary On August 10, 2026, a...
Aug 22, 2026PLTM Signal Follow-Up: 10 Days +7.31% Performance Review
PLTM Signal Follow-Up: 10 Days Review — +7.31% Performance Executive Summary On August 10, ...
Aug 22, 2026GLD Signal Follow-Up +4.21% in 10 Days: Hold Decision
GLD Signal Follow-Up - 10 Days Review: +4.21% Performance Executive Summary A trendchange signal ...
Aug 21, 2026SIL Signal Follow-Up: +10.15% at 10 Days – Hold Status
SIL Signal Follow-Up - 10 Days Review: +10.15% Performance Executive Summary A trendchange signal...
Aug 21, 2026XLK Signal Review: -2.59% After 10 Days, Exit Triggered
XLK Signal Follow-Up - 10 Days Review: -2.59% Performance Executive Summary XLK triggered a trend...
Aug 21, 2026