
COIN Signal Follow-Up – 10 Days Review: -8.86% Performance
Executive Summary
Our StockBotty signal triggered on March 11, 2026 at an entry price of $198.63, with a strong edge rating of 70.75%. After approximately 10 trading days, the position has declined to $181.04, representing a loss of -8.86%. This performance has triggered our predefined exit rule, and we recommend closing the position immediately.
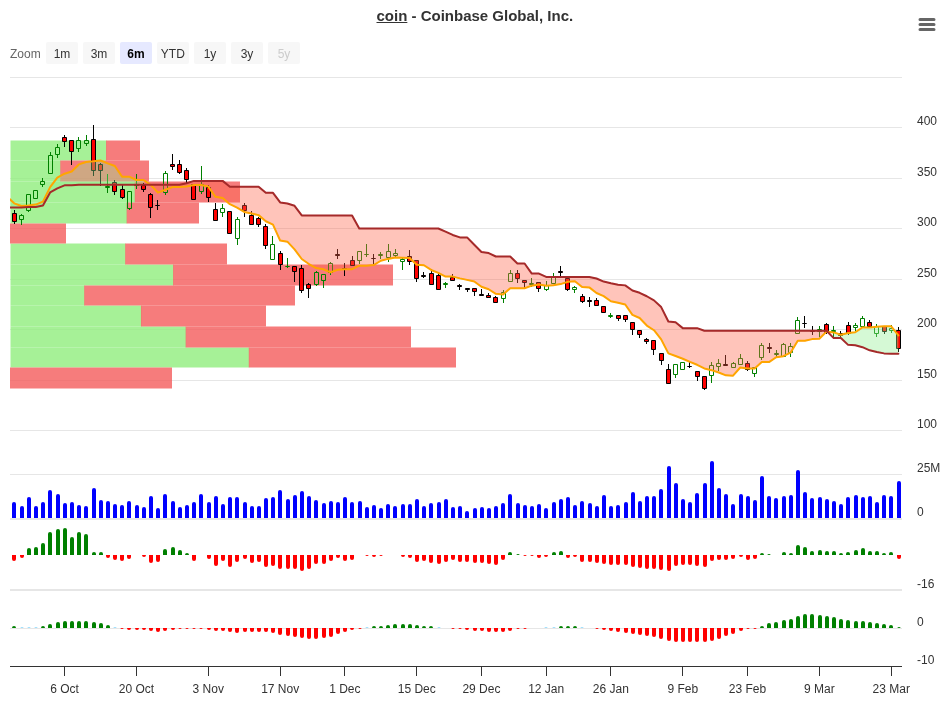
COIN Price Chart – March 25, 2026
Signal Recap: Understanding the Original Setup
On March 11, the COIN signal generated a 70.75% edge rating, indicating that our historical backtesting showed this pattern was profitable in approximately 7 out of 10 similar scenarios. This is a strong edge by most trading standards, suggesting the setup had legitimate potential for profit.
Let’s review the complete historical performance distribution that informed this signal:
| Price Range | Cases (N) | 10-Day Avg | 20-Day Avg | 30-Day Avg | 60-Day Avg | Signal |
|---|---|---|---|---|---|---|
| >20% | 3 | 29.22% | 25.6% | 24.0% | 53.9% | Hold |
| 15-20% | 1 | 16.02% | 47.4% | 81.6% | 184.8% | Hold |
| 10-15% | 1 | 14.12% | 34.4% | 39.8% | 42.9% | Hold |
| 5-7% | 2 | 5.58% | 0.4% | 4.3% | 0.0% | Close |
| 3-5% | 2 | 4.49% | 18.9% | 27.6% | 53.0% | Hold |
| -5-3% | 1 | -3.59% | 27.0% | 19.8% | -11.2% | Neg |
| -10-7% | 1 | -8.86% | 0.0% | 0.0% | 0.0% | Neg |
| <-10% | 6 | -16.86% | -12.0% | -21.5% | -9.4% | Neg |
The signal table shows that historically, when COIN moved more than 20% in the first 10 days, it continued gaining an average of 29.22%. The data was compelling enough to justify a 70.75% edge rating.
Performance Review: Where We Stand After 10 Days
| Metric | Value |
|---|---|
| Entry Date | March 11, 2026 |
| Entry Price | $198.63 |
| Review Date | March 24, 2026 |
| Current Price | $181.04 |
| Trading Days Elapsed | ~10 days |
| Performance | -8.86% |
| Current Price Range | -10% to -7% |
| Maximum Stoploss | -10% |
| Exit Rule Threshold | Less than 0% after 10 days |
| Exit Status | TRIGGERED |
Historical Comparison: What the Data Expected
Our current position sits squarely in the -10% to -7% range, which is historically a “Negative” signal zone. Looking back at historical performance for positions that landed in this range, the news is sobering.
Only 1 historical case produced a result in this -10-7% band at the 10-day mark. That single instance showed:
- 20-day performance: 0.0% (completely flat recovery)
- 30-day performance: 0.0% (still flat)
- 60-day performance: 0.0% (no meaningful bounce)
This tells us something important. When COIN entered this negative territory at day 10, history suggests the position stalled out completely through the next 50 days. Additionally, the “<-10%" range shows 6 historical cases where losses exceeded 10%, with those positions averaging -16.86% by day 10, then deteriorating further to -12.0% at 20 days and -21.5% at 30 days.
We’re currently at -8.86%, which is dangerously close to breaking through the maximum stoploss threshold of -10%.
Exit Decision: Time to Close
CLOSE – Exit Threshold Reached
Our predefined exit rule explicitly states: Close the position if performance is less than or equal to 0% after 10 days. At -8.86% after approximately 10 trading days, this rule is triggered.
Beyond the mechanical rule, the historical data reinforces this decision. Positions landing in the -10% to -7% range have shown zero recovery potential over the next 20, 30, and 60 days. This suggests the trade setup simply failed to materialize as expected.
The maximum stoploss of -10% is also approaching rapidly. Waiting further increases the risk of a deeper drawdown into the worse-performing bucket. The disciplined move is to exit now at -8.86% rather than risk falling through the stoploss floor.
Lessons and Key Takeaways
- High edge doesn’t guarantee every trade wins. A 70.75% edge means this setup wins roughly 7 out of 10 times. This was the losing 3. Statistical edges play out over many trades, not individual ones.
- Exit rules protect capital. By following our predetermined exit criteria, we limited losses to -8.86% rather than potentially -12% to -16% seen in worse historical cases. Discipline prevents emotional decisions during drawdowns.
- Historical ranges predict recovery potential. When a trade enters the “Negative” zone at day 10, the data historically shows it rarely recovers. Recognizing these patterns early allows traders to cut losses efficiently.
Conclusion
The COIN signal of March 11 represented a solid trading opportunity with strong historical backing. Unfortunately, the market moved against us, and after 10 trading days, we’re down -8.86%. This performance breached our exit rule threshold and positioned the trade in a historically poor recovery zone.
The recommended action is to close the position immediately. This preserves capital and prevents exposure to the deeper losses that typically follow when positions fall into negative territory at the 10-day mark. Sometimes the best trade is knowing when to exit.
Disclaimer: This article is for informational and educational purposes only. It is not financial advice, investment advice, or a recommendation to buy or sell COIN or any other security. Past performance is not indicative of future results. All trading involves risk, including potential loss of principal. Please conduct your own due diligence and consult with a qualified financial advisor before making any trading decisions.
Author Disclosure: This article discusses the author’s personal trade in COIN. The author holds or has held this position directly or through derivative instruments. This is not a trading recommendation. The views expressed here are the author’s personal analysis based on StockBotty’s signal methodology.
For more analysis visit stockbotty.com | Disclaimer: stockbotty.com/disclaimer
—
More Follow-Up from Signals and Trendchanges Articles
QQQ Signal Follow-Up: -1.03% After 10 Days | Exit Triggered
QQQ Signal Follow-Up - 10 Days Review: -1.03% Performance Executive Summary On August 10, 2026, a...
Aug 22, 2026FSLR Signal Follow-Up 10 Days: -10.47% Stoploss Exit
FSLR Signal Follow-Up - 10 Days Review: -10.47% Performance Executive Summary A trendchange signa...
Aug 22, 2026PLTM Signal Follow-Up: 10 Days +7.31% Performance Review
PLTM Signal Follow-Up: 10 Days Review — +7.31% Performance Executive Summary On August 10, ...
Aug 22, 2026LLY Signal Follow-Up – 10 Days: +1.90% Performance Review
LLY Signal Follow-Up - 10 Days Review: +1.90% Performance Executive Summary The LLY trendchange s...
Aug 22, 2026NFLX Signal Follow-Up +4.33% – 10 Days Review & Hold Decision
NFLX Signal Follow-Up - 10 Days Review: +4.33% Performance Executive Summary On August 10, 2026, ...
Aug 22, 2026