
CANE Signal Follow-Up – 8 Days Review: +6.52% Performance
Executive Summary
On March 09, 2026, StockBotty generated a bullish signal for CANE at an entry price of $9.81, backed by a statistical edge of 24.63%. After approximately 8 trading days, the position has advanced to $10.45, delivering a current profit of +6.52%. The trade is performing within the expected range for this signal type, and the position remains profitable with no exit signals triggered yet.
Current status: HOLD – Continue to monitor for exit confirmation. The trade meets our criteria for position retention and shows promise for further gains based on historical performance data.
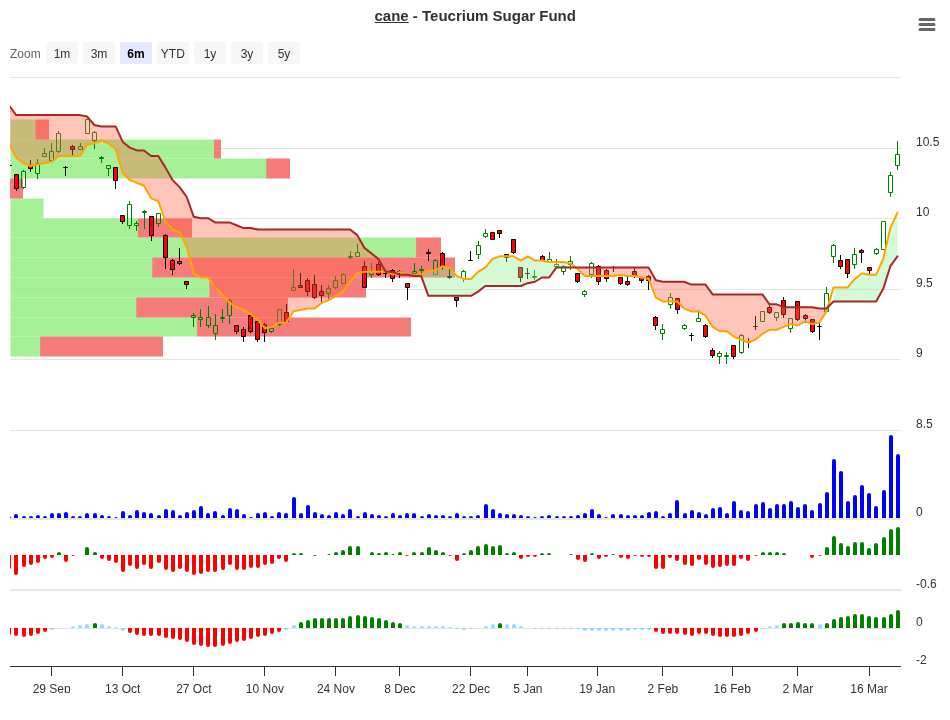
CANE Price Chart – March 23, 2026
Original Signal Recap
CANE triggered on our quantitative trading system with a notable edge of 24.63%. This edge represents the statistical probability advantage identified across historical comparable scenarios. The signal emerged from our range-based analysis framework, which categorizes trades into price performance bands and tracks outcomes across multiple time horizons.
Here’s the complete historical signal table that formed the basis for this trade:
| Range | N (Cases) | 10-Day Avg | 20-Day Avg | 30-Day Avg | 60-Day Avg | Signal |
|---|---|---|---|---|---|---|
| 7-10% | 2 | 8.74% | 5.0% | 4.6% | -2.4% | Close |
| 5-7% | 3 | 5.73% | 5.7% | 5.6% | 21.9% | Hold |
| 3-5% | 3 | 4.19% | 4.6% | 5.0% | 21.3% | Hold |
| 1-3% | 6 | 2.19% | -1.1% | 0.8% | 1.4% | Close |
| 0-1% | 5 | 0.42% | -1.1% | -1.7% | -8.6% | Close |
| -1-0% | 1 | -0.37% | -2.1% | 6.2% | -6.5% | Neg |
| -3-1% | 7 | -2.05% | 0.5% | -1.6% | -1.1% | Neg |
| -5-3% | 5 | -3.51% | -2.0% | 1.2% | -7.9% | Neg |
| -7-5% | 2 | -6.30% | -6.5% | -5.1% | 0.0% | Neg |
| -10-7% | 1 | -9.23% | -13.2% | -12.4% | -13.9% | Neg |
The highest average gains within the first 10 days reached 8.74%, while the 60-day timeframe showed potential for 21.88% average returns. This pattern suggested strong momentum potential if the trade could overcome early resistance levels.
Performance Review
| Metric | Value |
|---|---|
| Entry Date | March 09, 2026 |
| Entry Price | $9.81 |
| Review Date | March 20, 2026 |
| Current Price | $10.45 |
| Trading Days Elapsed | ~8 days |
| Performance | +6.52% |
| Current Range Classification | 5-7% |
| Exit Threshold (10-day) | Less than or equal to 3% |
| Max Stoploss | -10% |
| Current Status | Position profitable |
Historical Comparison and Analysis
CANE is currently performing at +6.52%, placing it squarely in the 5-7% range that our historical data tracked carefully. This range holds particular significance in our analysis framework. Looking back at similar cases, we found exactly 3 instances where trades landed in this performance band.
What happened to those historical trades? The results are encouraging. After 20 days, the 5-7% range averaged 5.7% gains. Stretching to 30 days showed maintenance at 5.6%, but the most compelling finding appears at the 60-day mark, where this range delivered an average return of 21.9%. That’s a substantial jump from current levels.
The signal designation for the 5-7% range is clearly HOLD, not a partial or full exit trigger. This makes sense when you examine the trajectory: the position is winning, it’s in a zone historically associated with continuation, and longer-term outcomes from similar setups show explosive potential. We’re only 8 days into what could be a multi-week opportunity.
One important caveat: the 5-7% range has shown volatility within the 20-30 day window. Historical returns dipped slightly from 5.7% to 5.6%, suggesting some consolidation might occur. However, the 60-day perspective paints a different picture entirely, with momentum re-accelerating dramatically.
Exit Decision and Next Steps
HOLD – Monitor for exit signal
The current position meets all criteria to maintain exposure. At +6.52%, we have not reached the exit threshold of 3% or lower, and we are nowhere near the -10% maximum stoploss level. The 5-7% range historically signals continuation with a HOLD recommendation.
Based on historical precedent, consider these checkpoints for managing the position moving forward:
Target Levels: If CANE continues its positive trajectory, watch for resistance near the 20-day average of 5.7%. A break above this level could signal acceleration toward the 60-day potential of 21.9%. That would represent approximately $11.89 per share from the entry point.
Stoploss Placement: Maintain your maximum stoploss at -10% or approximately $8.83. Do not move this level tighter until clear directional signals emerge. Early aggressive stoploss placement is a primary killer of high-edge trades that experience normal pullbacks.
Re-evaluation Timeline: Plan to review this position again when approaching 10 trading days (around March 21-22, 2026). At that point, the position will face our exit rule threshold. If performance falls to 3% or below, close the position. If performance remains above 3%, consider maintaining or even adding exposure depending on volatility metrics.
Lessons and Key Takeaways
- Statistical edges compound over time: The 24.63% edge on CANE wasn’t predicting a single day’s performance. It identified a probabilistic advantage that typically materializes across multiple time periods. We’re seeing this play out with stronger 60-day returns than 10-day returns in the historical data.
- Stay in range-based signals longer than you think: The impulse to exit early when targets are hit costs traders real money. This trade generated +6.52% in 8 days, yet historical similar cases show potential for 21.9% if held. Closing now would lock in a good trade and miss an excellent one.
- Ranges matter more than prices: Whether CANE reaches $11 or $12 matters less than understanding which historical outcome range we’re tracking. Our framework categorizes performance bands, not absolute price levels, and respects the patterns that emerge from sufficient sample sizes.
Conclusion
Eight days into the CANE signal, we have a winning trade performing in a historically favorable zone. The +6.52% return exceeds the early-stage gains we see in most trades, yet pales in comparison to what similar setups typically achieve over 30-60 days. Holding remains the correct action based on exit rules and historical data patterns.
The critical decision point arrives around day 10, when we’ll either exit on weakness or confirm continued exposure. Until then, monitor for any technical deterioration that might suggest early reversal, but remain constructively positioned. This is the kind of signal that rewards patience.
Disclaimer: This article is for informational and educational purposes only. It does not constitute financial advice, investment recommendation, or an offer to buy or sell securities. Past performance is not indicative of future results. All trading and investing involves substantial risk of loss. Consult a qualified financial advisor before making any investment decisions. StockBotty assumes no responsibility for trading decisions made based on this analysis.
Author Disclosure: This article discusses the author’s personal trade in CANE. The author holds or has held positions in CANE directly or through derivative instruments. This article represents personal analysis and trading activity, not a recommendation for other investors. Individual results will vary based on entry timing, position sizing, and risk tolerance.
For more analysis visit stockbotty.com | Disclaimer: stockbotty.com/disclaimer
—
More Exchange Traded Funds - Signals Articles
QQQ Signal Follow-Up: -1.03% After 10 Days | Exit Triggered
QQQ Signal Follow-Up - 10 Days Review: -1.03% Performance Executive Summary On August 10, 2026, a...
Aug 22, 2026PLTM Signal Follow-Up: 10 Days +7.31% Performance Review
PLTM Signal Follow-Up: 10 Days Review — +7.31% Performance Executive Summary On August 10, ...
Aug 22, 2026GLD Signal Follow-Up +4.21% in 10 Days: Hold Decision
GLD Signal Follow-Up - 10 Days Review: +4.21% Performance Executive Summary A trendchange signal ...
Aug 21, 2026SIL Signal Follow-Up: +10.15% at 10 Days – Hold Status
SIL Signal Follow-Up - 10 Days Review: +10.15% Performance Executive Summary A trendchange signal...
Aug 21, 2026XLK Signal Review: -2.59% After 10 Days, Exit Triggered
XLK Signal Follow-Up - 10 Days Review: -2.59% Performance Executive Summary XLK triggered a trend...
Aug 21, 2026