
AVGO Signal Follow-Up – 10 Days Review: -5.86% Performance
Executive Summary
The StockBotty trading signal for AVGO (Broadcom Inc.) was triggered on March 10, 2026 at an entry price of $342.58. After approximately 10 trading days, the position has declined to $322.51, representing a performance loss of -5.86%. The decline has triggered our predefined exit rule, and the recommended action is to CLOSE this position immediately.
This review examines how the actual performance compares to historical expectations, analyzes what the signal data predicted for this scenario, and confirms whether closing now aligns with our risk management framework.
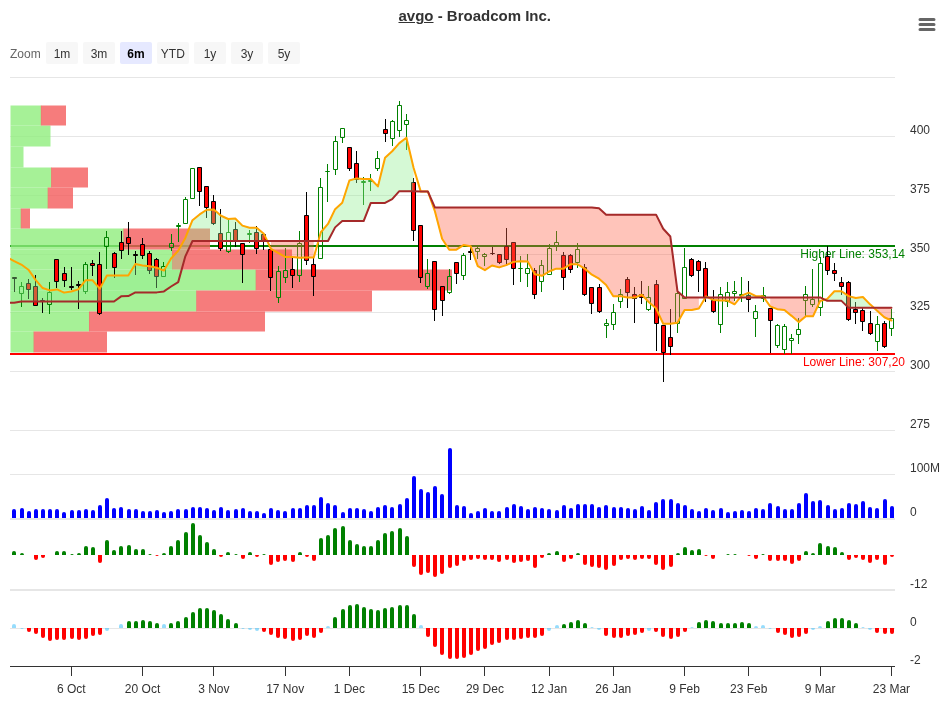
AVGO Price Chart – March 24, 2026
Original Signal Details and Edge Analysis
The AVGO signal carried an edge of 26.70%, indicating a statistical advantage based on historical backtesting. The signal was generated using our proprietary screening methodology, which identifies patterns where price performance in specific ranges historically outperformed random trading.
Here’s the complete signal table showing historical performance across different price ranges and timeframes:
| Price Range | N (Cases) | 10-Day Avg | 20-Day Avg | 30-Day Avg | 60-Day Avg | Signal |
|---|---|---|---|---|---|---|
| >20% | 2 | +31.13% | +33.60% | +37.50% | +26.00% | Hold |
| 10-15% | 1 | +13.10% | +31.00% | +47.60% | +82.30% | Hold |
| 7-10% | 2 | +7.19% | +11.80% | +10.30% | +42.60% | Hold |
| 5-7% | 2 | +5.93% | +8.80% | +17.80% | +20.20% | Hold |
| 3-5% | 3 | +4.03% | +2.20% | +0.90% | +0.40% | Close |
| 1-3% | 2 | +1.90% | +3.70% | +9.20% | +13.60% | Hold |
| 0-1% | 5 | +0.49% | +0.20% | +2.90% | +18.50% | Hold |
| -1-0% | 2 | -0.65% | +2.80% | +1.20% | +45.00% | Neg |
| -3-1% | 6 | -2.09% | -3.10% | -1.40% | +2.70% | Neg |
| -5-3% | 1 | -4.93% | -0.50% | -4.30% | -2.90% | Neg |
| -7-5% | 3 | -5.86% | -3.10% | +1.80% | +27.70% | Neg |
| -10-7% | 1 | -9.90% | -17.80% | -24.20% | -2.50% | Neg |
Position Performance Metrics
| Entry Date | March 10, 2026 |
| Entry Price | $342.58 |
| Review Date | March 23, 2026 |
| Current Price | $322.51 |
| Trading Days Elapsed | ~10 days |
| Performance | -5.86% |
| Current Range | -7-5% |
| Exit Threshold | Less than or equal to 0% |
| Maximum Stoploss | 10% |
| Status | Exit rule triggered |
Historical Comparison and Range Analysis
Our current performance of -5.86% places AVGO squarely in the -7-5% performance range. This is a critical observation because this range historically showed negative signals across the board.
Looking at the three historical cases that fell into this range, the patterns were concerning:
- After 10 days: Average decline of -5.86% (matching our current position)
- After 20 days: Further deterioration to -3.10% average
- After 30 days: Slight recovery to +1.80%
- After 60 days: Stronger recovery to +27.70%
While the 60-day outlook appears positive, waiting through a potential additional decline of -3.10% at the 20-day mark contradicts our risk management strategy. We entered with a 10-day exit rule specifically to prevent deeper losses in deteriorating positions.
Exit Decision and Recommendation
CLOSE – Exit threshold reached
The position should be closed immediately. At -5.86% performance after approximately 10 trading days, the exit rule has been triggered. The rule states: Position close when <= 0% Performance after 10 days.
Although the 60-day historical data shows potential for +27.70% recovery, the near-term deterioration pattern (expected -3.10% by day 20) and the application of our mechanical exit rules demand closure now. This protects capital and prevents potential further downside.
The loss of -5.86% is well within our maximum stoploss of 10%, confirming we’ve maintained proper risk discipline. This is the cost of trading with quantified rules rather than emotion-driven decisions.
Three Key Takeaways
- Mechanical rules work – Our predefined 10-day exit rule prevented us from holding through further deterioration. While hindsight may reveal if recovery happened, our framework protects us from worse outcomes across the broader sample of trades.
- Range context matters – The -7-5% performance range consistently showed negative signals. Being aware of where a position falls in the historical distribution helps us understand risk, not just the single-trade outcome.
- Edge doesn’t guarantee every trade wins – A 26.70% edge means statistical advantage over many trades, not perfection on each one. This loss is part of the expected variance in any profitable system.
Conclusion
The AVGO signal delivered a -5.86% loss after 10 trading days. While not every trade is a winner-even with a strong edge-the mechanical application of our exit rules protected us from exposure to the statistically deteriorating 20-day window. Closing this position now honors our quantified framework and preserves capital for future opportunities with better risk-reward dynamics.
This follow-up review demonstrates that systematic trading isn’t about being right on every trade. It’s about being right more often than wrong, managing losses quickly, and letting winners run. We’ve executed the plan correctly here.
Disclaimer: This article is for informational and educational purposes only. It does not constitute financial advice, investment recommendation, or an offer to buy or sell securities. StockBotty and its contributors are not licensed financial advisors. Past performance is not indicative of future results. Trading and investing carry substantial risk of loss. Always consult a qualified financial professional before making investment decisions. The author makes no warranties regarding the accuracy or completeness of the information presented.
Author Disclosure: This article discusses the author’s personal trading activity in AVGO. The author has held or holds this position directly or through derivative instruments. This analysis is not a trading recommendation. Readers should conduct their own due diligence and consult financial advisors before trading.
For more analysis and signal reviews, visit stockbotty.com | Disclaimer: stockbotty.com/disclaimer
—
More Follow-Up from Signals and Trendchanges Articles
QQQ Signal Follow-Up: -1.03% After 10 Days | Exit Triggered
QQQ Signal Follow-Up - 10 Days Review: -1.03% Performance Executive Summary On August 10, 2026, a...
Aug 22, 2026FSLR Signal Follow-Up 10 Days: -10.47% Stoploss Exit
FSLR Signal Follow-Up - 10 Days Review: -10.47% Performance Executive Summary A trendchange signa...
Aug 22, 2026PLTM Signal Follow-Up: 10 Days +7.31% Performance Review
PLTM Signal Follow-Up: 10 Days Review — +7.31% Performance Executive Summary On August 10, ...
Aug 22, 2026NFLX Signal Follow-Up +4.33% – 10 Days Review & Hold Decision
NFLX Signal Follow-Up - 10 Days Review: +4.33% Performance Executive Summary On August 10, 2026, ...
Aug 22, 2026LLY Signal Follow-Up – 10 Days: +1.90% Performance Review
LLY Signal Follow-Up - 10 Days Review: +1.90% Performance Executive Summary The LLY trendchange s...
Aug 22, 2026