
VIX at 30.61: Markets Signal Extreme Fear as Volatility Surges
The VIX currently stands at 30.61, marking a critical juncture in market sentiment. While the index ticked down slightly from yesterday’s 31.05, a loss of just 0.44 points (-1.42%), the broader picture reveals something far more concerning: volatility has exploded by 3.66 points (+13.58%) over the past five days. This report breaks down what extreme VIX levels mean for your portfolio and where fear might be heading next.
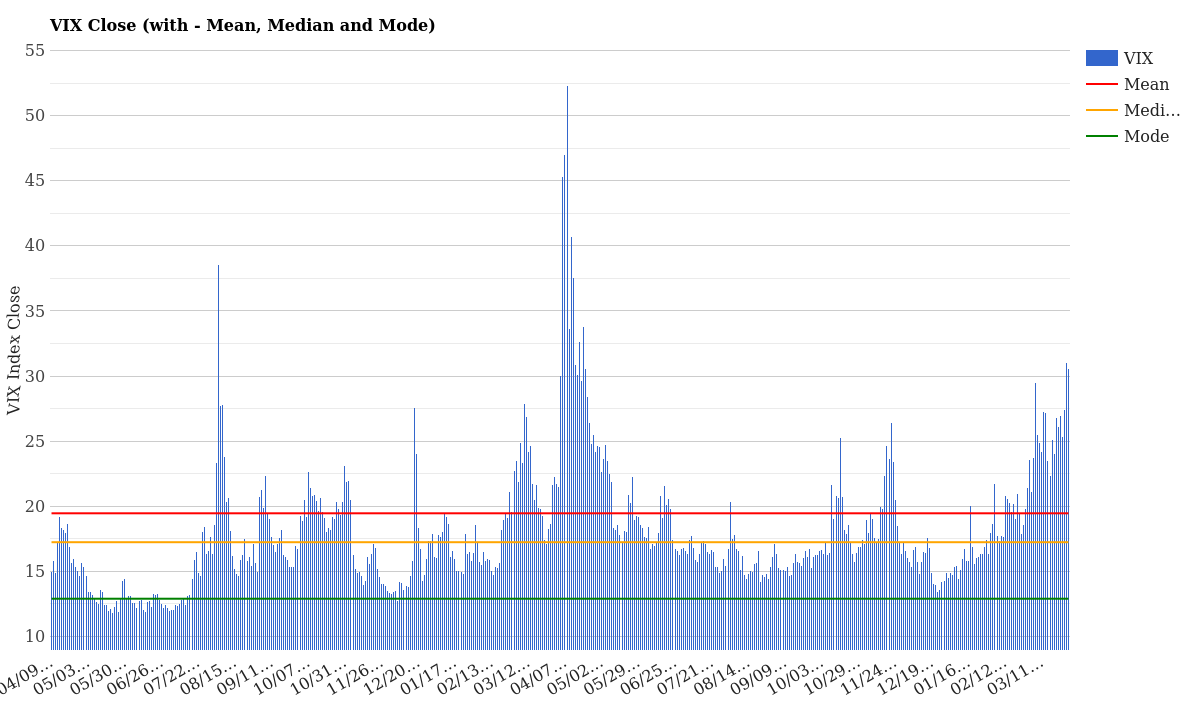
VIX Close with Mean, Median and Mode – March 31, 2026
What the Current VIX Level Means
A VIX reading of 30.61 places markets deep in the fear zone. To put this in perspective, the long-term mean sits at 19.46, meaning today’s level is 11.15 points higher than average. Even more striking: we’re trading 13.37 points above the median of 17.24.
You’re looking at a volatility level that shows up in only the top 14.1% of all trading days over the past year-and at the absolute extreme end year-to-date. Historically, when the VIX climbs this high, institutional fear is real and markets are pricing in significant uncertainty.
| Metric | Value | Status |
|---|---|---|
| VIX Close (Today) | 30.61 | Extreme Fear |
| Daily Change | -0.44 (-1.42%) | Slight Relief |
| 5-Day Change | +3.66 (+13.58%) | Sharp Spike |
| vs. 2-Year Mean (19.46) | +11.15 points | Well Above Normal |
| vs. 2-Year Median (17.24) | +13.37 points | Significantly Elevated |
| 1-Year Percentile | 85.9% | Top 14% of Days |
| YTD Percentile | 100.0% | Highest This Year |
When VIX crosses above 30, it typically signals capitulation or major portfolio rebalancing among professional investors. Options become expensive, hedging costs spike, and traders brace for potential 2-3% daily moves in equities. For a full explanation of the VIX and how it’s calculated, see our complete VIX guide.
VIX Term Structure: Short-Term vs Long-Term Fear
One crucial signal lies hidden in how volatility changes across different timeframes. Today’s term structure shows backwardation</strong-short-term fear outpacing longer-term concerns. Here's what that breakdown looks like:
| Contract | Expiration | Value Today | 5-Day Change |
|---|---|---|---|
| VIX9D | 9 days | 30.57 | +2.30 |
| VIX (Spot) | ~30 days | 30.61 | +3.66 |
| VIX3M | 3 months | 29.13 | +1.53 |
| VIX6M | 6 months | 29.68 | +2.47 |
| VIX1Y | 1 year | 28.07 | +1.37 |
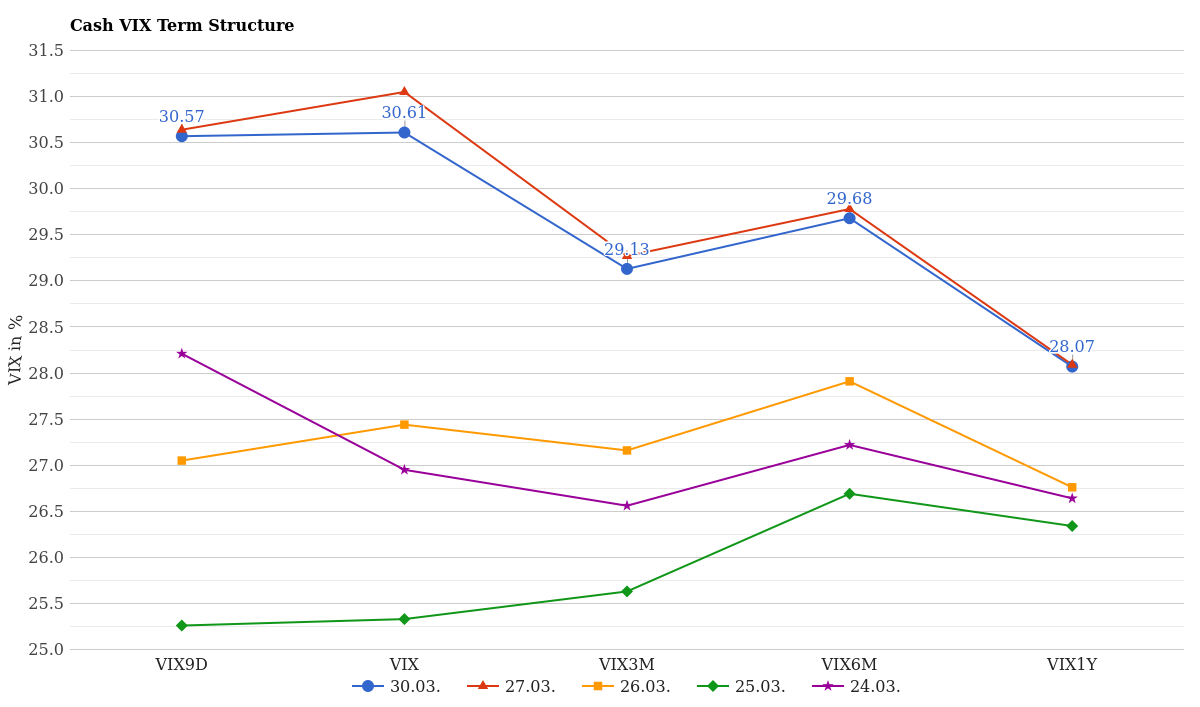
Cash VIX Term Structure (VIX9D to VIX1Y) – Last 5 Days
Backwardation tells an important story: the market is pricing in immediate danger but expects conditions to gradually stabilize over time. The 9-day contract is nearly identical to the spot VIX, yet the 1-year contract trails at 28.07. This 2.54-point difference suggests traders believe the acute crisis phase will pass, but elevated uncertainty persists for months ahead.
Such structures often appear during earnings seasons, geopolitical uncertainty, or major economic data releases. Expect this pattern to persist until an actual catalyst resolves the near-term concern.
How Volatility Has Changed This Week
Looking at the cash VIX index curve across the past week reveals a sharp acceleration in fear. Monday (March 24) started with a relatively calm 24.94, but by Tuesday March 25, it had dropped to 24.29. Then the reversal began.
| Expiry Month | March 24 | March 25 | March 26 | March 27 | March 30 (Today) | 5-Day Change |
|---|---|---|---|---|---|---|
| April | 24.94 | 24.29 | 26.26 | 28.49 | 28.21 | +3.27 |
| May | 24.15 | 23.80 | 25.10 | 26.49 | 26.45 | +2.30 |
| June | 23.84 | 23.55 | 24.55 | 25.68 | 25.70 | +1.86 |
| July | 23.89 | 23.70 | 24.40 | 25.30 | 25.35 | +1.46 |
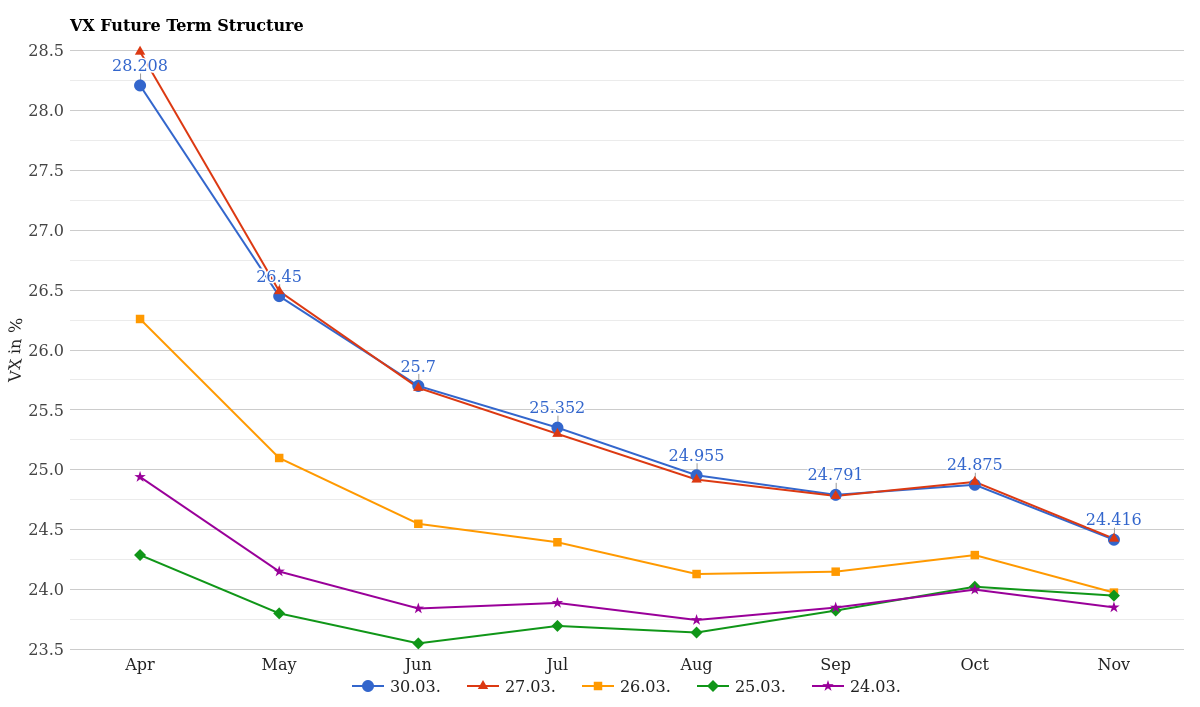
VX Future Term Structure – Last 5 Days
Notice how the curve shifted across the board-every single month from April through November posted gains. This isn’t a rotation into longer-dated fear; it’s a broad-based spike affecting the entire term structure. When the whole curve rises together like this, it signals systemic risk, not just tactical hedging.
How Rare Is This VIX Level Historically?
To gauge just how extreme today’s reading is, we examine the distribution of VIX closes across different periods. Over the past 12 months, where does 30.61 sit in the ranking?
The data shows that a VIX level of 30 or higher has occurred only 5 times in the past year. More strikingly, year-to-date, today’s reading is literally the highest we’ve seen. The nearest peer in the past 12 months was 30, which appeared on a single occasion.
| VIX Range | Days (Last 12M) | Days (YTD 2026) | Frequency Assessment |
|---|---|---|---|
| 13-14 | 25 days | 11 days | Normal Range |
| 15-16 | 42 days | 15 days | Normal Range |
| 20-29 | 55 days | 8 days | Elevated Volatility |
| 30+ | 5 days | 1 day | Extreme Fear |
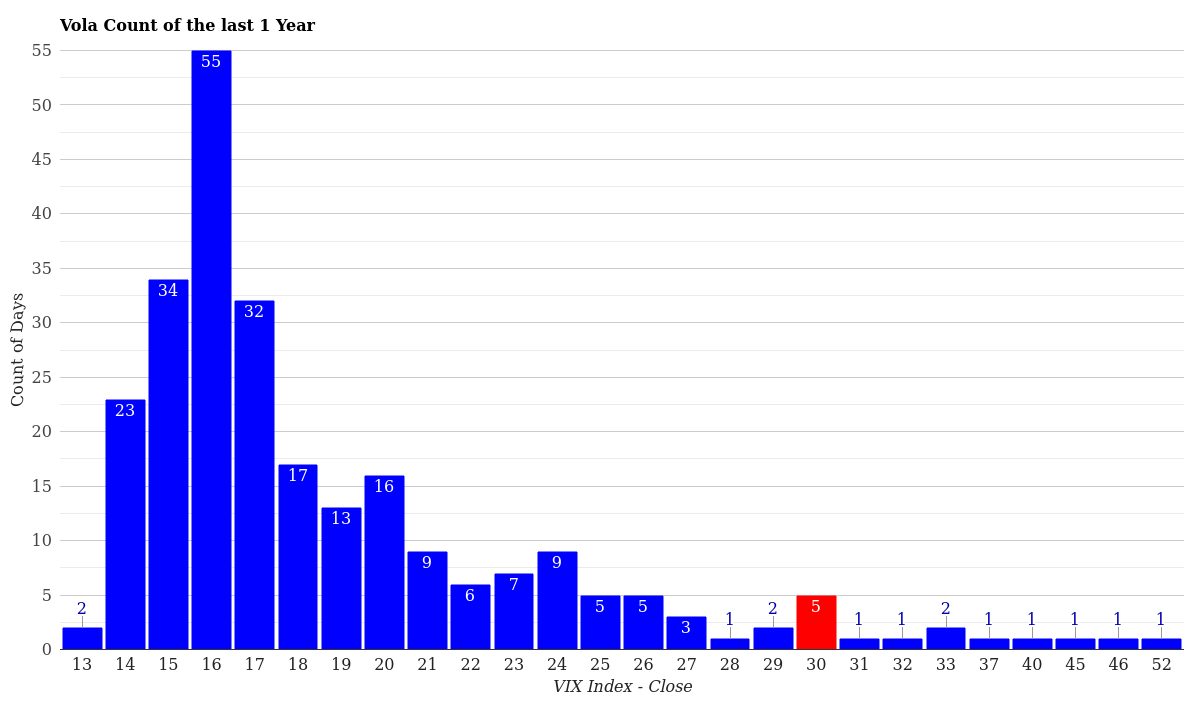
VIX Volatility Distribution – Last 12 Months
The most common VIX levels historically cluster between 15-16 (42 occurrences) and 20-29 (55 occurrences). By contrast, readings above 30 are rare outliers-only 5 times in the past year.
Year-to-date, we’ve seen no readings above 31 until today, making this moment notable. The jump from relative stability in early March to extreme readings now shows how quickly market psychology can shift when a major catalyst hits.
What This Means for Traders Right Now
Extreme VIX readings create both danger and opportunity. Here’s what matters most for your trading decisions:
Expect Volatility to Persist. Backwardated term structures typically sustain for days or weeks. Don’t assume a quick snap-back to normal. The 9-day contract still sits at 30.57, virtually identical to the spot, indicating near-term turbulence is priced in.
Options Are Expensive. When VIX crosses 30, implied volatility surges across all strikes. Selling premium becomes attractive for experienced traders, but buying protection is pricey. If you’re hedging, cost becomes a key consideration.
Watch the Term Structure Slope. If the 3-month and 6-month contracts start falling faster than the near-term, it’s a sign of healing. That would be a green flag. Conversely, if longer-dated fear rises to match the short-term, expect sustained elevated levels.
Support Levels Matter. Historically, VIX reversals from 30+ often find support in the 25-28 range before resuming normalcy. Monitor if today’s spike holds above 28 or rolls over toward 25 in coming sessions.
Monitor Equities Correlation. At 30 VIX, stock correlations tend to spike toward 0.8+, meaning individual security performance matters less than broad market direction. Diversification temporarily breaks down, so position sizing becomes critical.
Conclusion & Market Outlook
The VIX at 30.61 reflects a market that has shifted into genuine fear mode over a 5-day window. The 13.58% jump from last week and 100% year-to-date percentile ranking confirm this is among 2026’s most volatile trading days. Backwardation in the term structure suggests the acute phase should eventually pass, but expect several more sessions of elevated uncertainty.
For traders, this environment demands tight risk management and realistic position sizing. For long-term investors, remember that VIX spikes are temporary-historically, they’ve marked buying opportunities for patient capital willing to endure short-term pain.
Keep monitoring the 28-30 zone as a critical support level and watch for the term structure to begin flattening as confidence returns. Browse our daily VIX reports for historical volatility context and updated analysis as conditions evolve.
For more market analysis visit stockbotty.com | Disclaimer