
VIX at 27.44: Markets Enter Stress Territory as Fear Spikes 8%
The VIX currently stands at 27.44, marking a sharp jump of +2.11 points (+8.33%) in a single session. This level signals that market participants are pricing in genuine concern about near-term equity movements, and we’re now solidly in what traders call the “stress zone.” Today’s report breaks down what this spike means, how rare this volatility level is historically, and what you should be watching as markets navigate this period of elevated fear.
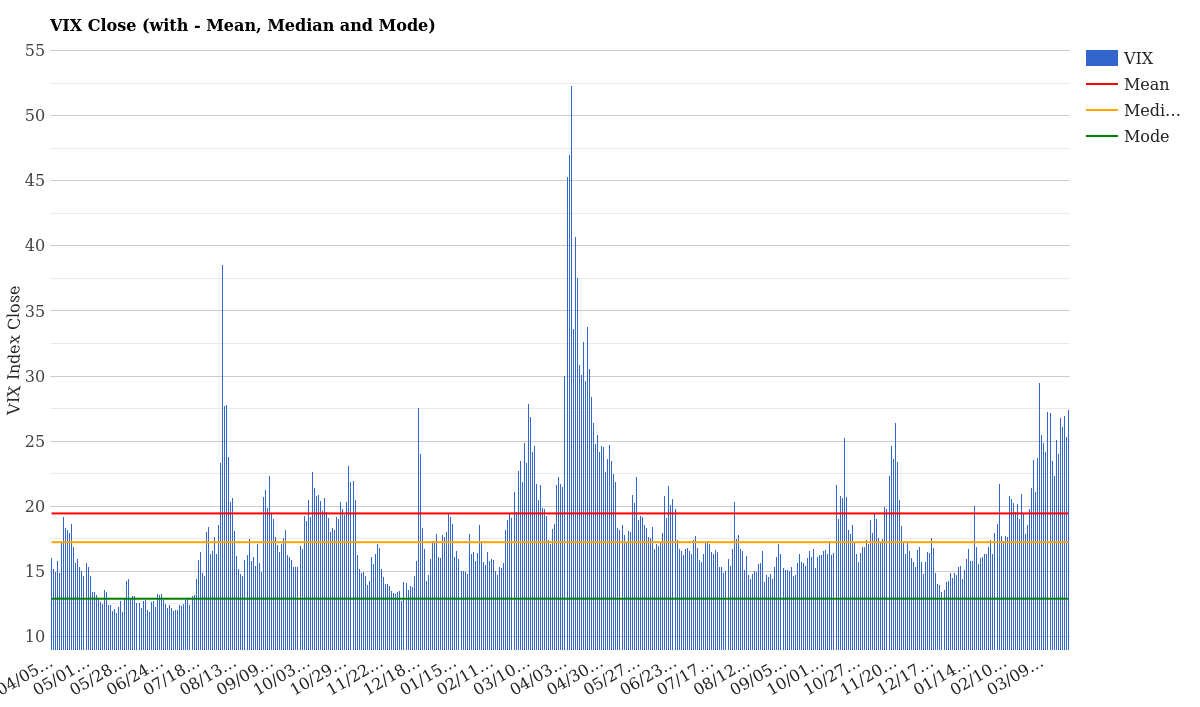
VIX Close with Mean, Median and Mode – March 27, 2026
What the Current VIX Level Means
At 27.44, the VIX sits significantly above its two-year median of 17.24 and well above the mean of 19.45. To put this in perspective, you’re looking at volatility that’s roughly 10 points higher than normal trading conditions-a material jump that doesn’t happen every week.
Here’s what traders should understand: a VIX above 25 typically indicates that professional options traders are pricing in larger-than-average price swings over the next 30 days. This isn’t panic (that usually starts around 35-40), but it’s definitely caution. The market is saying “be careful” rather than “the sky is falling.”
| Metric | Value | Assessment |
|---|---|---|
| VIX Close (03/26/26) | 27.44 | High Volatility / Stress Zone |
| Daily Change | +2.11 (+8.33%) | Sharp Spike |
| 2-Year Mean | 19.45 | +7.99 above average |
| 2-Year Median | 17.24 | +10.20 above median |
| 1-Year Percentile | 76.7% | More volatile than 3 out of 4 days |
| Year-to-Date Percentile | 100.0% | Most volatile day of 2026 |
Year-to-date, this is the single most volatile trading day we’ve seen in 2026. That’s significant. It tells us something material happened-either actual market moves or a sudden shift in how traders are hedging their portfolios against risk.
VIX Term Structure: Short-Term vs Long-Term Fear
One of the most useful tools for understanding the market’s mood is the VIX term structure-essentially, how fear is distributed across different time horizons. Today’s structure reveals something interesting about where the anxiety is concentrated.
| Contract | Today (03/26) | Yesterday (03/25) | Change |
|---|---|---|---|
| VIX9D (9-day) | 27.05 | 25.26 | +1.79 |
| VIX (30-day) | 27.44 | 25.33 | +2.11 |
| VIX3M (3-month) | 27.16 | 25.63 | +1.53 |
| VIX6M (6-month) | 27.91 | 26.69 | +1.22 |
| VIX1Y (1-year) | 26.76 | 26.34 | +0.42 |
The structure shows contango-that’s when longer-dated volatility sits above shorter-term volatility. In plain English: fear is more intense in the next 30 days than it is nine days out. However, the 6-month contract is actually the highest point on the curve at 27.91, suggesting that traders are hedging against risks that extend deeper into the spring and summer.
Notice that the 1-year contract (26.76) barely moved from yesterday. This suggests that long-term structural concerns haven’t dramatically shifted-it’s the near-term picture that’s spooking markets. For a full explanation of the VIX and how futures work, see our complete VIX guide.
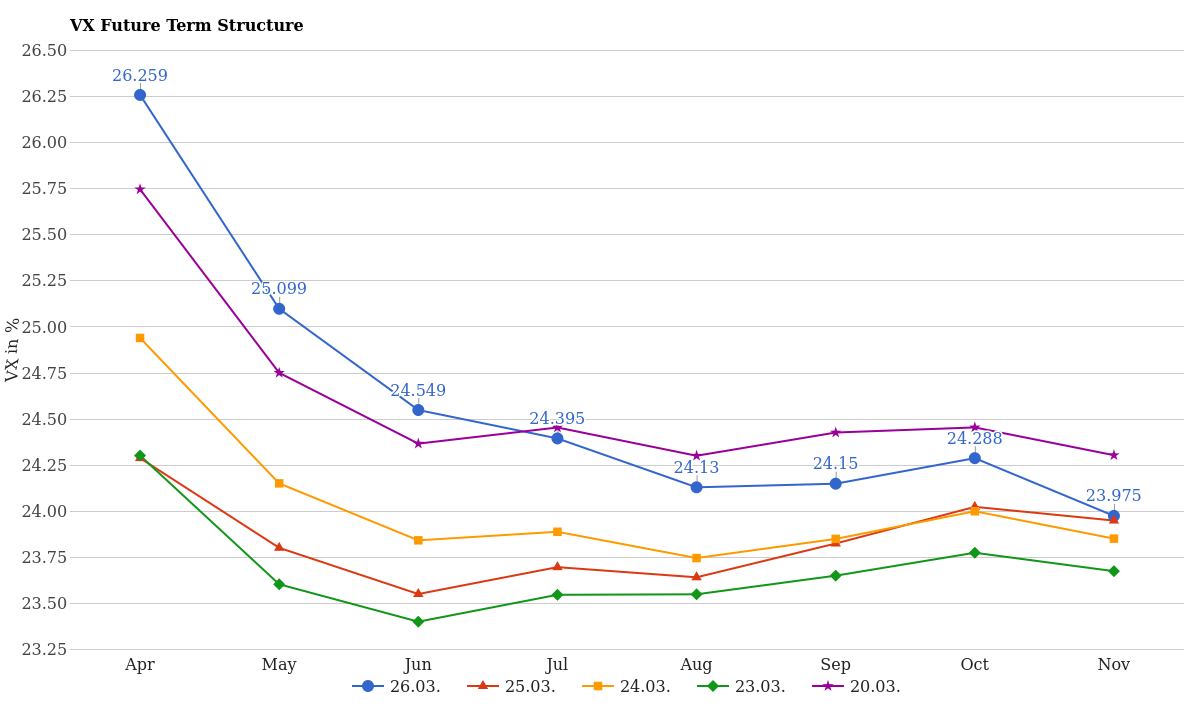
VX Future Term Structure – Last 5 Days
How Volatility Has Changed This Week
Zooming out to a five-day perspective reveals the trajectory we’re on. Let’s look at the cash VIX index curve across the April through November contracts.
| Contract | 03/26 | 03/25 | 03/24 | Change (5-Day) |
|---|---|---|---|---|
| April | 26.26 | 24.29 | 24.94 | +0.51 |
| May | 25.10 | 23.80 | 24.15 | +0.36 |
| June | 24.55 | 23.55 | 23.84 | +0.18 |
| July | 24.40 | 23.70 | 23.89 | -0.05 |
| August | 24.13 | 23.64 | 23.75 | -0.17 |
The five-day trend shows a consistent rise in implied volatility across the curve, with the sharpest gains in the near-term contracts (April and May). This isn’t random-it reflects that something specific is making traders nervous about the coming weeks. By the time we get to August and beyond, the increases flatten out, suggesting the market expects volatility to cool later in the year.
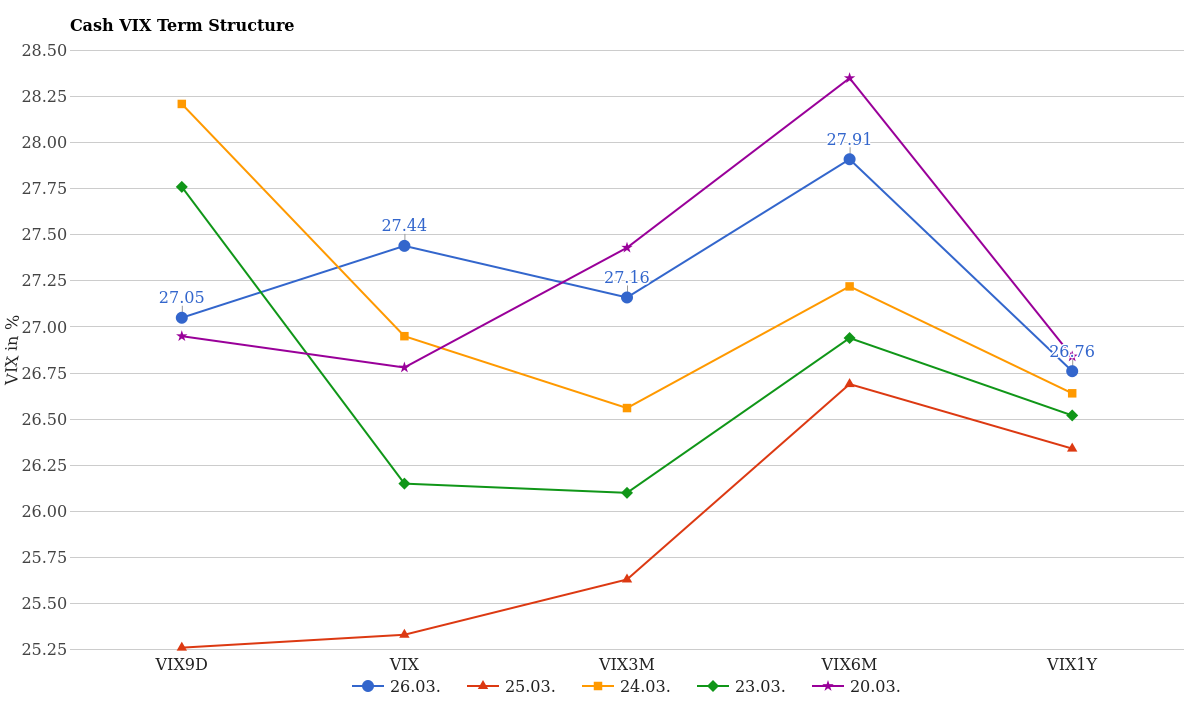
Cash VIX Term Structure (VIX9D to VIX1Y) – Last 5 Days
How Rare Is This VIX Level Historically?
Here’s where context matters: just because the VIX is at 27 doesn’t automatically mean panic is setting in. We need to ask-how often does the market reach this level, and what typically happens next?
Looking at the one-year volatility count, a VIX reading of 27 has occurred exactly 3 times in the past 12 months. That’s rare but not unprecedented. More telling: we’ve only seen one instance of a 28-reading in the past year, which tells us that today’s 27.44 puts us near the upper edge of “normal stress” without crossing into full-blown panic territory.
| VIX Range | 1-Year Count | YTD Count | Frequency |
|---|---|---|---|
| 13-15 | 69 | 19 | Most common zone |
| 16-20 | 87 | 17 | Normal range |
| 21-26 | 55 | 3 | Elevated stress |
| 27+ | 11 | 3 | Crisis/rare stress |
In the year-to-date sample, we’ve hit 27 or higher exactly three times already. That tells you the market has been jittery in 2026, but it also shows we haven’t escaped into genuine safety territory either. Compare this to the 13-20 range, which dominates market behavior-today’s 27.44 is fundamentally different from your typical trading day.
Interestingly, readings above 40 have occurred only once in the past year (the single 45+ instance, and one 46+ spike). So while 27 is elevated, we’re still well below true panic-which historically clusters around 35-50+.
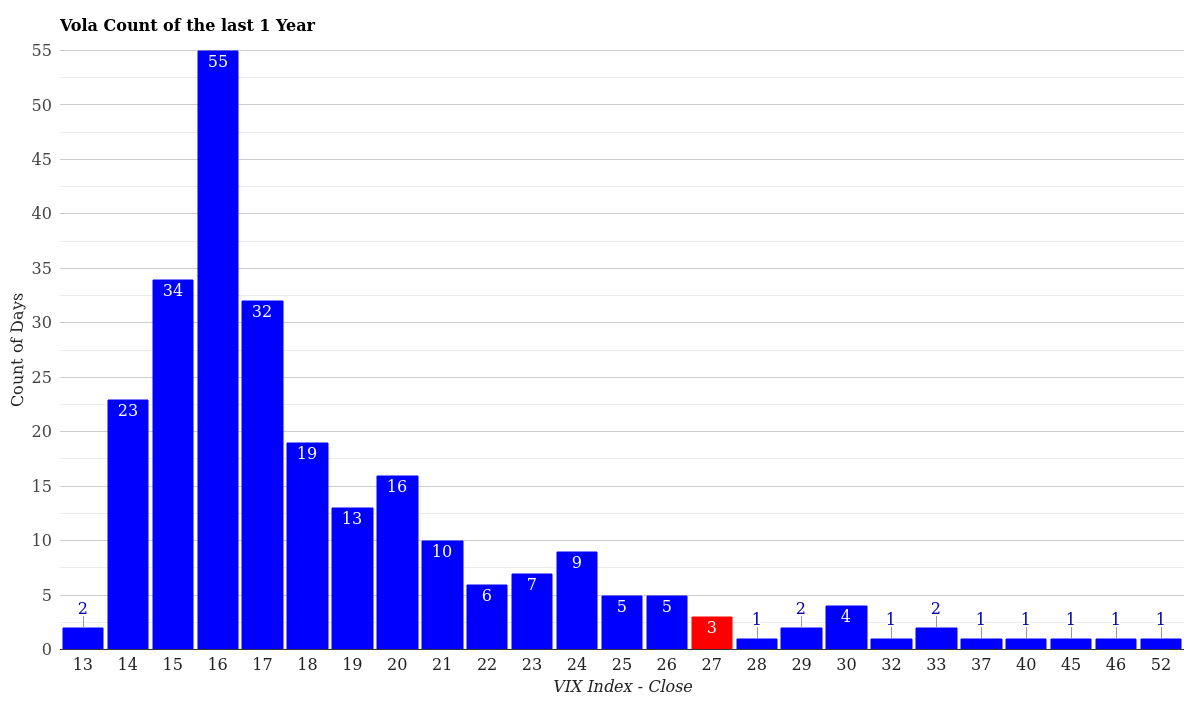
VIX Volatility Distribution – Last 12 Months
What This Means for Traders Right Now
If you’re holding equity positions, today’s VIX spike is a signal to review your portfolio positioning. At 27.44, options are expensive-implied volatility is pricing in larger moves, which means you should expect wider-than-average price swings in both directions over the next month.
For options traders, the environment is interesting. Long volatility plays (VIX calls, long straddles on the index, or VXX positions) are becoming profitable, but be aware: mean reversion is a powerful force. The VIX tends to spike suddenly and fall just as fast. If you’re buying volatility here, you’re betting on sustained fear, not just a brief scare.
For swing traders and day traders in equities, wider spreads and higher transaction costs due to increased volatility are the practical reality. Stop-losses should be adjusted to account for the larger daily swings. The 76.7% 1-year percentile tells us we’re in a regime that only occurs roughly once every four trading days, so don’t assume this volatility is “normal” right now.
The term structure showing contango (shorter-term spikes more than longer-term) suggests this fear might be concentrated around a specific near-term event or catalyst. Traders who can identify what’s driving the spike have an edge. Is it earnings season volatility? Geopolitical news? Fed-related anxiety? The structure itself doesn’t tell you, but it tells you to look closely at the next 30 days.
Conclusion & Market Outlook
The VIX at 27.44 represents a meaningful but not catastrophic shift in market fear. We’ve moved from “calm” into “stressed,” and the +8.33% daily jump demands attention. However, the fact that longer-dated contracts are only modestly elevated tells us the market still has faith in a recovery or resolution over time.
What matters now is whether this is a one-day spike or the beginning of a sustained elevation. History suggests it could go either way. Keep an eye on whether the 27-30 range holds or breaks higher, and watch for the term structure to invert (if short-term fear suddenly exceeds long-term fear-that’s a red flag for traders).
For more perspective on market volatility trends, browse our daily VIX reports and volatility analysis archive to understand how today fits into the broader macro picture.
For more market analysis visit stockbotty.com | Disclaimer: stockbotty.com/disclaimer