
VIX at 26.95: Markets Enter High-Stress Territory
The VIX currently stands at 26.95, marking a significant shift into elevated volatility territory. This 3.06% daily jump from yesterday’s 26.15 reading reflects genuine market stress, with the index climbing 7.41% over just five trading days. Today’s report breaks down what this level means for traders, why short-term fear is elevated, and where volatility may head next.
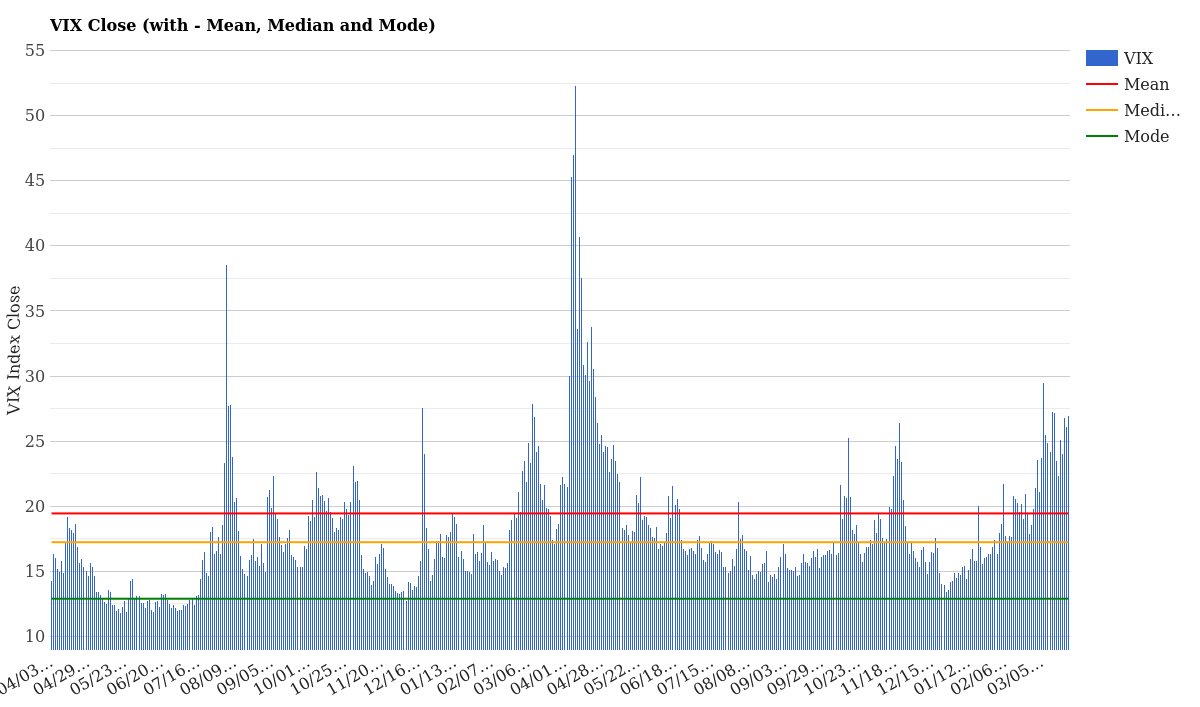
VIX Close with Mean, Median and Mode – March 25, 2026
What the Current VIX Level Means
A VIX reading of 26.95 places us squarely in what traders call the “stress zone.” To understand this, we need context. Over the past two years, the average VIX close has been 19.45, while the typical (median) reading sits at 17.24. Today’s level runs 7.50 points above the mean and 9.71 points above the median, confirming that current volatility is genuinely elevated.
Looking at historical frequency, today’s VIX level sits at the 73.2% percentile over the past year-meaning roughly three-quarters of all trading days have seen lower volatility. Year-to-date, we’re at the 100th percentile, indicating this is among the most volatile periods we’ve seen in 2026.
| Metric | Value | Context |
|---|---|---|
| VIX Close (Today) | 26.95 | High volatility territory |
| Daily Change | +0.80 (+3.06%) | Meaningful 1-day increase |
| 5-Day Change | +1.86 (+7.41%) | Week-long volatility surge |
| 2-Year Mean | 19.45 | +7.50 points above average |
| 2-Year Median | 17.24 | +9.71 points above typical |
| 1Y Percentile | 73.2% | Most days saw lower volatility |
| YTD Percentile | 100.0% | Highest reads this year so far |
What does this mean in practical terms? At 26.95, investors are pricing in material uncertainty about the near-term direction of equity markets. This isn’t panic territory (which typically begins around 30), but it’s well above the “calm” zone. For a complete explanation of how the VIX works and what drives these moves, see our complete VIX guide.
VIX Term Structure: Short-Term vs Long-Term Fear
One of the most telling aspects of today’s volatility picture is the shape of the VIX futures curve. Rather than a smooth climb from near to far-dated contracts, we’re seeing significant backwardation-meaning near-term fear is elevated compared to longer-dated expectations.
| Tenor | Level (03/24) | Prior Day | Interpretation |
|---|---|---|---|
| VIX9D | 28.21 | 27.76 | Immediate fear spike |
| VIX (Spot) | 26.95 | 26.15 | Current market fear level |
| VIX3M | 26.56 | 26.10 | 3-month outlook remains tense |
| VIX6M | 27.22 | 26.94 | Elevated expectations extend out |
| VIX1Y | 26.64 | 26.52 | Year-ahead volatility remains elevated |
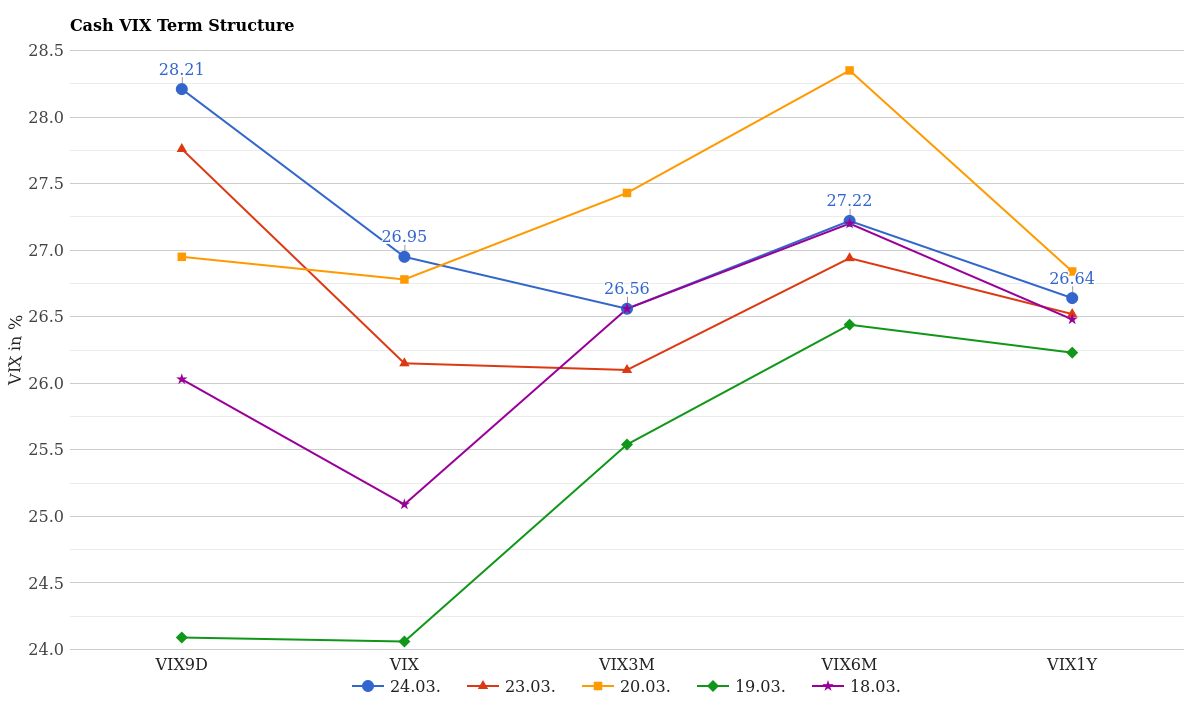
Cash VIX Term Structure (VIX9D to VIX1Y) – Last 5 Days
Here’s what stands out: the VIX9D (9-day) reading of 28.21 is the single highest point on the curve. This tells us traders are bracing for volatility in the immediate next 1-2 weeks. The fact that the 6-month and 1-year tenors remain stuck in the 26-27 range suggests the market believes current turbulence won’t easily dissipate.
In a healthy market, we’d typically see a smoother, upward-sloping curve-meaning near-term fear gets priced out and longer-dated contracts sit lower. That’s not what we have here. This backwardation is a classic signal that something immediate is bothering the market, but the broader outlook hasn’t stabilized either.
How Volatility Has Changed This Week
Let’s zoom out and see the five-day trading pattern. Over the course of the week, VIX futures for key delivery months have all moved higher, signaling a broad-based volatility increase rather than a sector-specific or isolated spike.
| Month | 03/24 | 03/23 | 03/20 | 5-Day Change |
|---|---|---|---|---|
| Apr | 24.94 | 24.30 | 25.75 | -0.81 |
| May | 24.15 | 23.60 | 24.75 | -0.60 |
| Jun | 23.84 | 23.40 | 24.37 | -0.53 |
| Jul | 23.89 | 23.55 | 24.45 | -0.56 |
| Aug | 23.75 | 23.55 | 24.30 | -0.55 |
| Sep | 23.85 | 23.65 | 24.43 | -0.58 |
| Oct | 24.00 | 23.78 | 24.45 | -0.45 |
| Nov | 23.85 | 23.68 | 24.30 | -0.45 |
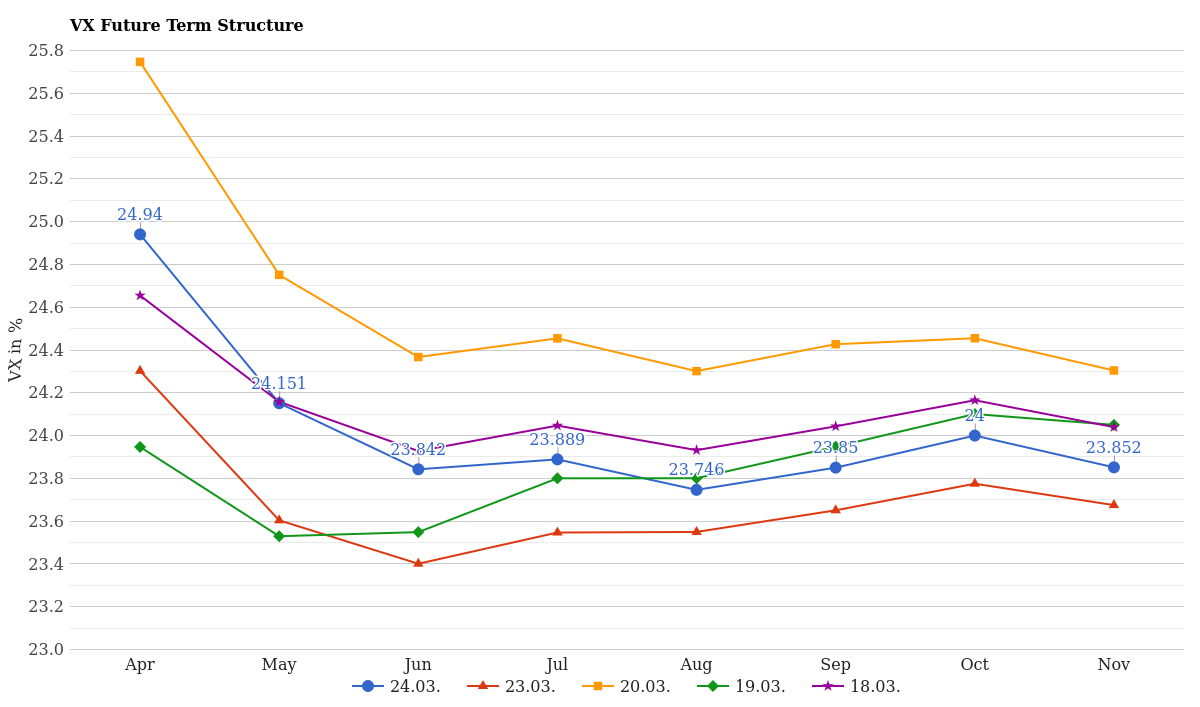
VX Future Term Structure – Last 5 Days
Interesting pattern here: April and May contracts are notably softer than the rest of the curve, sitting in the 24-point range. But by June onward, we see a floor establish around 23.84-24.00. The fact that all months have pulled back slightly from the previous Friday’s close (March 20) tells us there’s been some mean-reversion or profit-taking, yet the overall level remains compressed at 23-25 across the entire term structure.
This pattern is typical when immediate fear spikes but traders still expect normalization in the coming weeks. The curve isn’t panicking about April or May specifically-it’s more concerned about right-now.
How Rare Is This VIX Level Historically?
To truly gauge how unusual today’s volatility is, we need to look at frequency. Over the past year, how many days have the VIX closed at or near 26.95?
| VIX Level (1Y) | Frequency | % of Year |
|---|---|---|
| 13-14 | 25 days | 9.9% |
| 15-17 | 89 days | 35.3% |
| 18-20 | 35 days | 13.9% |
| 21-23 | 16 days | 6.3% |
| 24-26 | 14 days | 5.6% |
| 27-29 | 5 days | 2.0% |
| 30+ | 7 days | 2.8% |
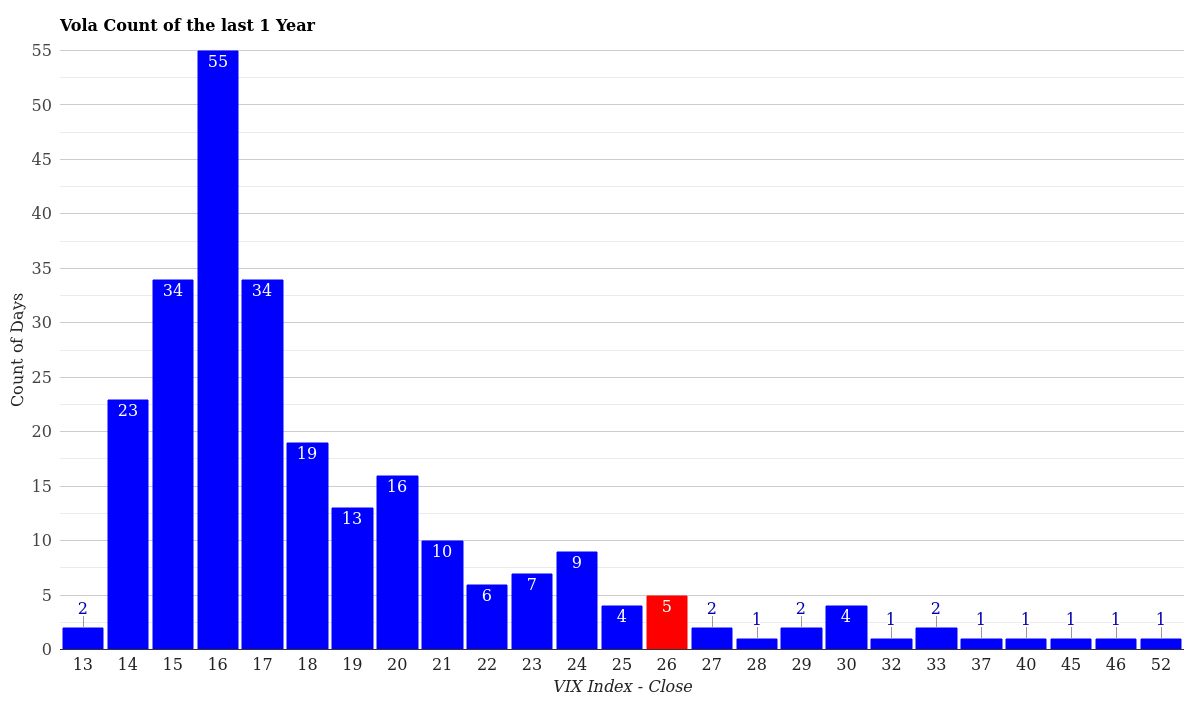
VIX Volatility Distribution – Last 12 Months
The data is striking. VIX readings in the 24-26 range occurred on just 14 trading days over the full year-roughly 5.6% of all sessions. Today sits right in that band. Only 5 days saw 27-29, and a mere 7 days exceeded 30. This means today’s volatility level is genuinely uncommon.
Now let’s check the year-to-date picture, which is even more striking:
| VIX Level (YTD) | Frequency | Interpretation |
|---|---|---|
| 14-17 | 25 days | Normal Q1 volatility |
| 18-20 | 16 days | Elevated but manageable |
| 21-25 | 8 days | Stress days (including today) |
| 26+ | 3 days | Severe stress (near-panic) |
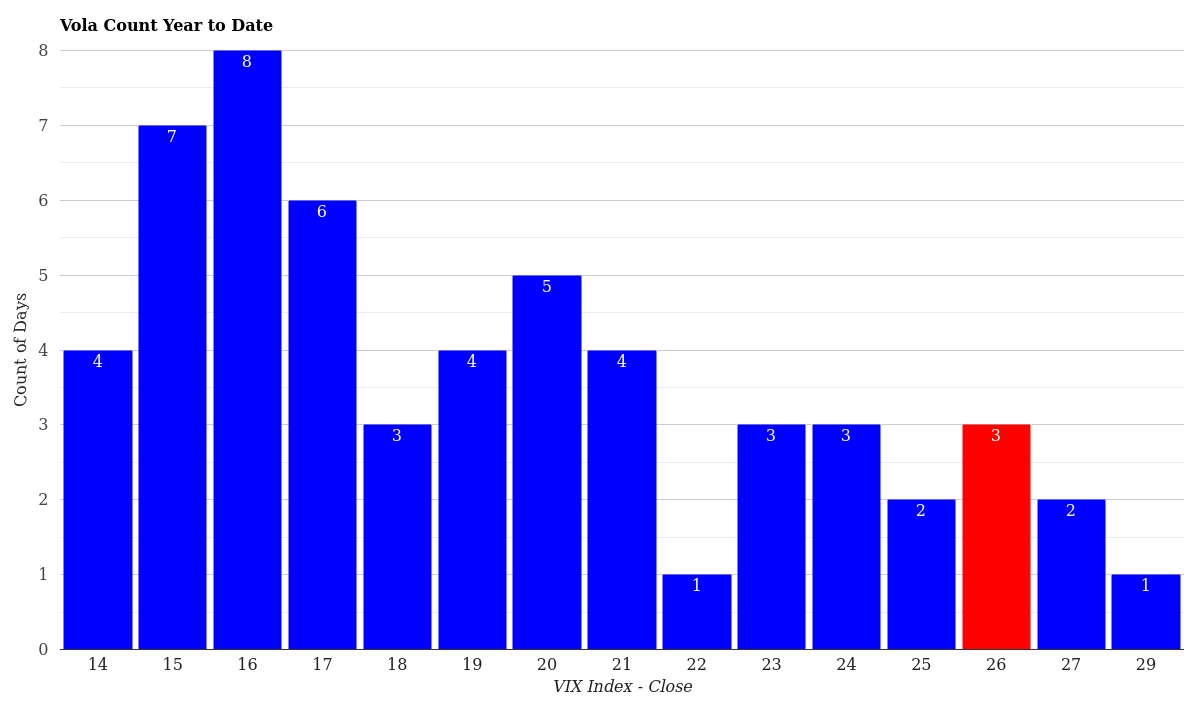
VIX Volatility Distribution – Year to Date
Year-to-date, we’ve now experienced 8 days at or above 21, with today’s 26.95 representing the highest reading since 2026 began. The data shows that volatility has been rising with intensity-March has clearly been a more turbulent month than January and February on average.
What This Means for Traders Right Now
If you’re holding long equity positions, a VIX of 26.95 signals caution. This isn’t a capitulation panic spike (those typically hit 35+), but it’s elevated enough that downside protection becomes valuable. Options premiums are expensive right now-both puts and calls trade at elevated implied volatility, making hedges costly but also creating short premium opportunities for those comfortable selling volatility.
Short-term traders should watch the 28.21 level on VIX9D futures. If that breaks higher into the high 20s or 30s, we’re moving from “stress” into “fear zone.” Conversely, if the spot VIX rolls back below 24 on strong market performance, that would signal stabilization.
Key levels to monitor:
Resistance: 28-30 (panic threshold)
Support: 24-25 (the curve’s baseline going forward)
Critical Watch: The 5-day moving average. If we see another day-over-day +3% to +5% move in the VIX, it suggests the market hasn’t yet found its footing. A down move back toward 24 would indicate relief and potential mean-reversion buying.
Conclusion & Market Outlook
Today’s VIX close of 26.95 reflects genuine market stress-not panic, but genuine unease. The 3.06% daily jump and 7.41% weekly surge confirm volatility is expanding, driven by near-term uncertainty (as evidenced by the elevated VIX9D at 28.21). The fact that intermediate and longer-dated contracts remain elevated above 26 tells us this isn’t a single-day event traders expect to wash out quickly.
Historically, today’s level is rare but not unprecedented. We’ve seen 26-plus volatility roughly 5-8 times per year on average, making this notable but not a black-swan event. The 100th YTD percentile rating suggests March 2026 is shaping up to be a volatile month.
For traders, the message is clear: stay flexible, use strict position sizing, and watch the 28-30 zone carefully. If volatility pushes above that, we’re moving into more serious territory. For now, elevated volatility premiums offer both hedging opportunities and short-selling opportunities-choose wisely based on your conviction and risk tolerance.
For historical context and additional volatility analysis, browse our daily VIX reports archive.
This article is for informational purposes only and does not constitute financial or investment advice. All data is historical and statistical. Past performance is not indicative of future results. Volatility trading carries significant risk, including potential loss of principal. Consult a qualified financial advisor before making investment decisions.
The author may hold or has held positions in VIX-related instruments directly or through derivative constructs at the time of publication. This is not a trading recommendation. Always conduct your own due diligence.
For more market analysis visit stockbotty.com | Disclaimer