
VIX at 21.04: Sharp Volatility Pullback as Markets Find Their Footing
After a turbulent week that sent the VIX soaring into the low 50s, today’s reading of 21.04 represents a dramatic reset. Markets are recalibrating following intense selling pressure earlier this week, and the fear gauge is retreating rapidly from extreme levels. In this report, we’ll examine what this pullback means, whether it signals genuine calm or a temporary reprieve, and what traders should watch in the sessions ahead.
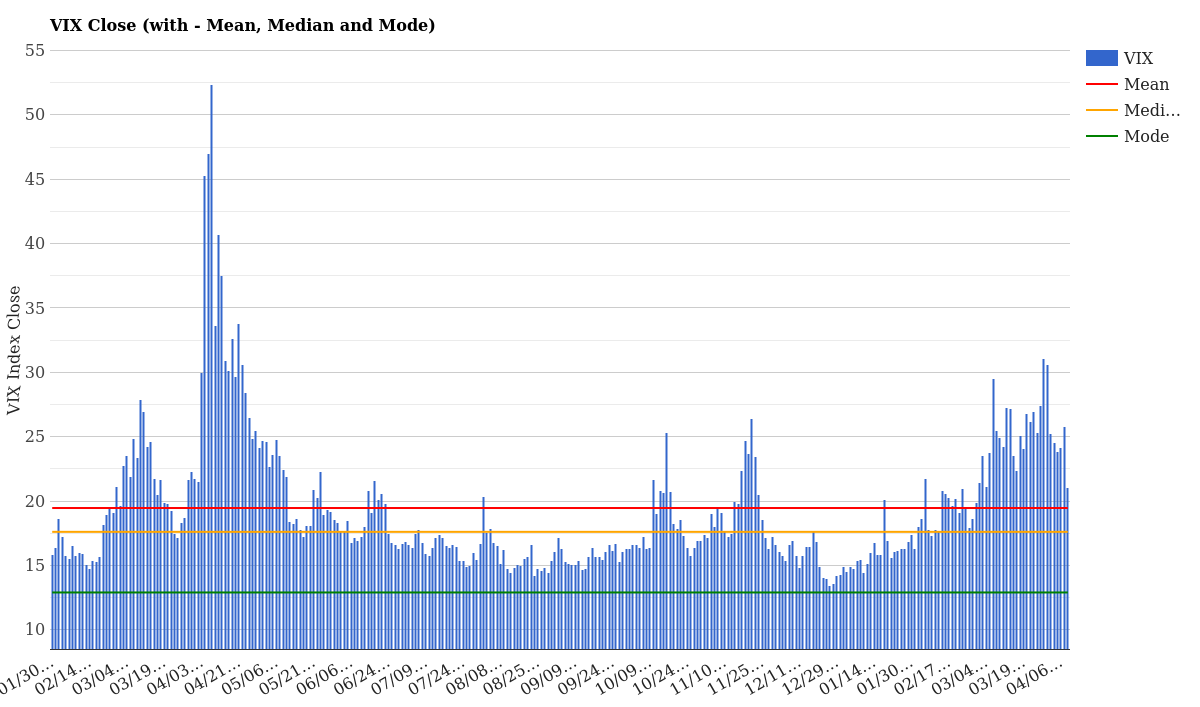
VIX Close with Mean, Median and Mode – April 09, 2026
What the Current VIX Level Means
The VIX closed yesterday at 25.78, making today’s 21.04 a decline of 4.74 points, or -18.39% in a single day. This is substantial relief, though it’s important to keep perspective: we’re still well above the two-year mean of 19.46 and significantly higher than the median of 17.24. The current level sits at the 52nd percentile of all 1-year readings, meaning roughly half of recent trading days have been calmer than today.
Let’s put this in context with a snapshot of where we stand:
| Metric | Value | Status |
|---|---|---|
| VIX Close (Today) | 21.04 | Above Mean |
| Daily Change | -4.74 (-18.39%) | Declining (Good) |
| 5-Day Change | -3.50 (-14.26%) | Declining Trend |
| 2-Year Mean | 19.46 | +1.58 above |
| 2-Year Median | 17.24 | +3.80 above |
| Volatility Regime | Elevated | Caution Still Warranted |
At 21.04, we’re in elevated but not extreme volatility territory. This level reflects genuine concern in the markets-it’s not the complacency we see below 15-but it’s nowhere near the panic readings we experienced earlier this week when the VIX briefly touched 52.33 on April 8th. For a full explanation of the VIX and how it behaves across market conditions, see our complete VIX guide.
VIX Term Structure: Short-Term vs Long-Term Fear
One of the most telling features of today’s volatility landscape is the contango structure we see across the VIX futures curve. This means short-dated volatility is lower than longer-dated volatility-exactly what we want to see in a normalizing market.
| Contract | Today (04/08) | Yesterday (04/07) | Change |
|---|---|---|---|
| VIX 9-Day | 19.16 | 27.27 | -8.11 |
| VIX Spot | 21.04 | 25.78 | -4.74 |
| VIX 3-Month | 22.68 | 25.57 | -2.89 |
| VIX 6-Month | 24.02 | 26.41 | -2.39 |
| VIX 1-Year | 24.45 | 25.78 | -1.33 |
Notice the upward slope from near-term to longer-term: 19.16 → 21.04 → 22.68 → 24.02 → 24.45. This normal contango structure tells us that traders expect volatility to normalize over the next 9 days, but remain modestly elevated through the next year. Yesterday’s catastrophic inversion has already begun reversing.
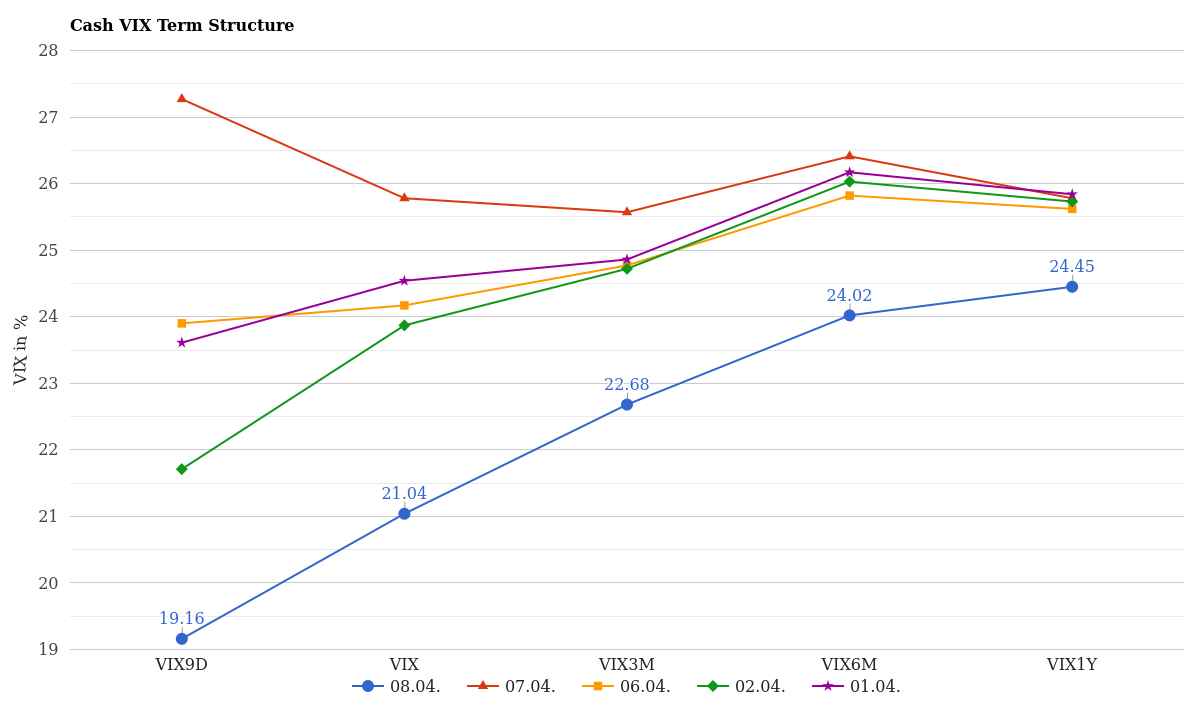
Cash VIX Term Structure (VIX9D to VIX1Y) – Last 5 Days
The 9-day contract collapsed by 8.11 points in a single session, which is extraordinary. Institutions and hedgers are rapidly unwinding short-term panic positions. By contrast, the longer-dated contracts are falling more gradually, suggesting the market still prices in elevated uncertainty beyond the immediate crisis window.
How Volatility Has Changed This Week
Early April brought a significant volatility event that we can now track across the VIX term structure. Let’s examine the cash VIX progression over the past week:
| Expiration | April 1 | April 2 | April 6 | April 7 | April 8 |
|---|---|---|---|---|---|
| April | 24.45 | 24.48 | 23.84 | 24.98 | 21.67 |
| May | 23.91 | 23.95 | 23.31 | 24.00 | 21.91 |
| June | 23.75 | 23.70 | 23.28 | 23.60 | 22.08 |
| July | 23.90 | 23.83 | 23.53 | 23.70 | 22.52 |
| August | 23.85 | 23.67 | 23.54 | 23.61 | 22.60 |
The progression shows remarkable relief across all expirations. The most dramatic action is in the front-month April contract, which fell from 24.98 yesterday to 21.67 today-a drop of nearly 3.3 points. This indicates that panic buying of volatility has largely ended and sellers are finally stepping in at reasonable valuations.
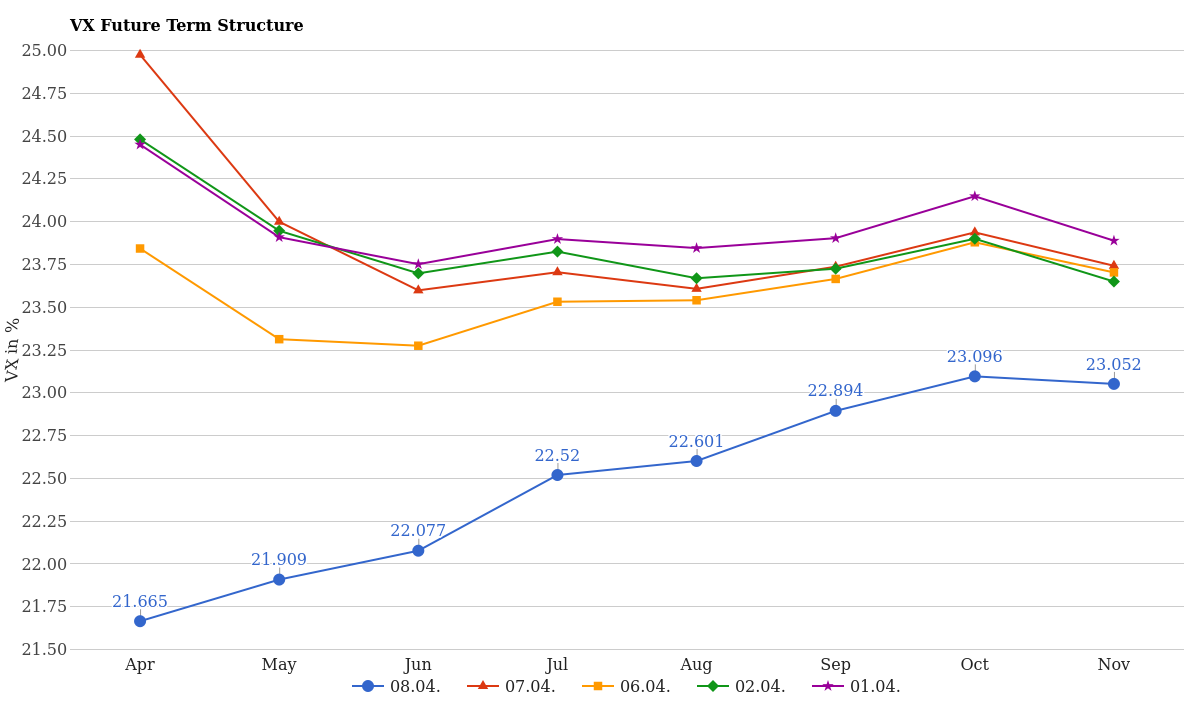
VX Future Term Structure – Last 5 Days
Every contract across the entire curve experienced two-digit percentage declines in just 24 hours. August through November all fell by approximately 0.5 to 1.4 points. Such synchronized relief suggests institutional rebalancing and algorithmic buying in equities, not a fundamental shift in economic outlook.
How Rare Is This VIX Level Historically?
Where does 21.04 sit in the historical distribution? Let’s examine the one-year and year-to-date volatility counts to understand whether this reading is common or unusual:
| VIX Range | Days (1Y) | Days (YTD) | Frequency |
|---|---|---|---|
| 13-14 | 2 + 23 | 4 | Rare this year |
| 15-16 | 34 + 55 | 7 + 8 | Moderate |
| 17-18 | 32 + 17 | 6 + 3 | Common |
| 19-20 | 13 + 16 | 4 + 5 | Regular |
| 21-22 | 8 + 5 | 1 + 4 | This zone (rare YTD) |
| 23-25 | 8 + 11 | 8 + 6 | Elevated |
| 26-30 | 5 + 7 | 3 + 5 | Stress |
| 31-40 | 4 + 3 | 1 + 1 | Panic |
| 40+ | 2 | 0 | Extreme Panic |
This is the critical insight: in the past year, VIX readings between 21-22 have occurred only 13 times, but this year we’ve only seen that zone 5 times before today. The year-to-date percentile of 100% indicates that today’s reading is higher than virtually all pre-April 2026 readings this year-we’ve been in a much calmer regime until the recent volatility spike.
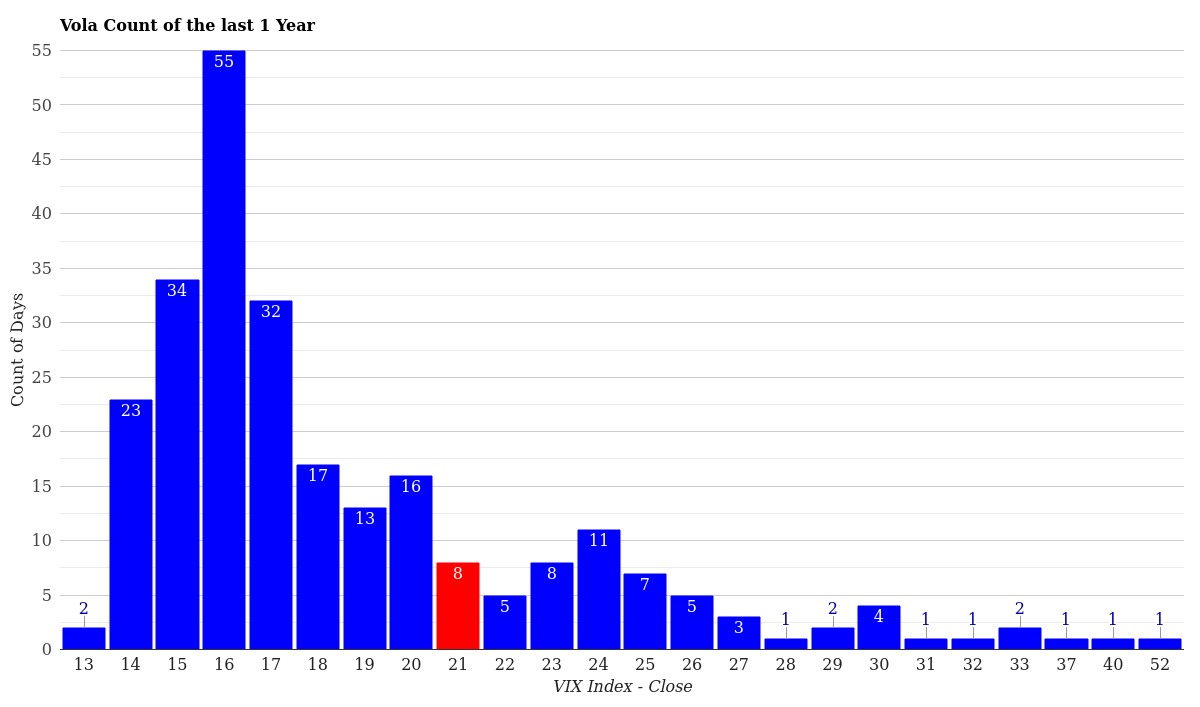
VIX Volatility Distribution – Last 12 Months
Zoom out to the full year and 21.04 remains in the upper quartile of observed VIX levels. Days in the 19-20 range are substantially more common. The bottom line: we’re elevated but not in uncharted territory anymore.
What This Means for Traders Right Now
Today’s sharp pullback from 25.78 to 21.04 carries several tactical implications:
Short-term volatility buyers are exiting. The 9-day contract’s 8.11-point drop is not normal price action-this reflects panicked buyers from earlier this week taking profits. If you were long volatility near the 50 level, you’re probably liquidating today at whatever market offers.
Mean-reversion pressure is building. We’re only 1.58 points above the two-year mean of 19.46, which is historically where the VIX finds support. If equities stabilize and earnings don’t surprise to the downside, we could see 18-19 levels within days or weeks.
Contango is back to normal. The healthy upward slope in the term structure (19.16 to 24.45) is exactly what you want to see post-crisis. This allows hedgers to roll positions efficiently and removes forced selling pressure from maturity-driven rebalancing.
Watch the 19-20 support level closely. This is where the 2-year median sits. A close above 22 tomorrow would suggest the relief is overdone and more uncertainty remains. A steady break below 19 would signal genuine capitulation sentiment has been flushed.
For options traders, IV percentile rank has likely fallen from extreme highs earlier this week. This matters: short premium positions are no longer getting paid crisis premiums, so new shorts may need better setup. Long volatility positions are still underwater relative to the 50+ peaks but are profitable compared to the 14-15 levels we saw in late February.
Conclusion & Market Outlook
Today’s 21.04 VIX close represents a critical inflection point in this week’s volatility event. The sharp -18.39% daily decline and the restoration of normal contango structure signal that institutional panic has mostly subsided. We’re back in “elevated but manageable” territory rather than “market meltdown” territory.
However, this is not a return to complacency. We remain above the mean and median, and the year-to-date pattern shows we’ve spent most of 2026 in much calmer regimes. Traders should view this as a respite, not a resolution. Monitor economic data, earnings guidance, and central bank communications for clues about whether the spike was event-driven or signal of deeper stress.
Browse our daily VIX reports for historical volatility context and to track how quickly (or slowly) we revert to the mean in the weeks ahead.
For more market analysis visit stockbotty.com | Disclaimer: stockbotty.com/disclaimer