
VIX at 19.49: Markets Pull Back from Fear Peaks
The VIX closed at 19.49 on April 9, 2026, marking a meaningful retreat from the elevated volatility that gripped markets just days earlier. This 7.37% daily decline signals that traders are stepping back from their most fearful positioning, even as uncertainty remains above historical norms. In this report, we’ll examine what this cooling pressure means for your portfolio and where volatility is likely heading next.
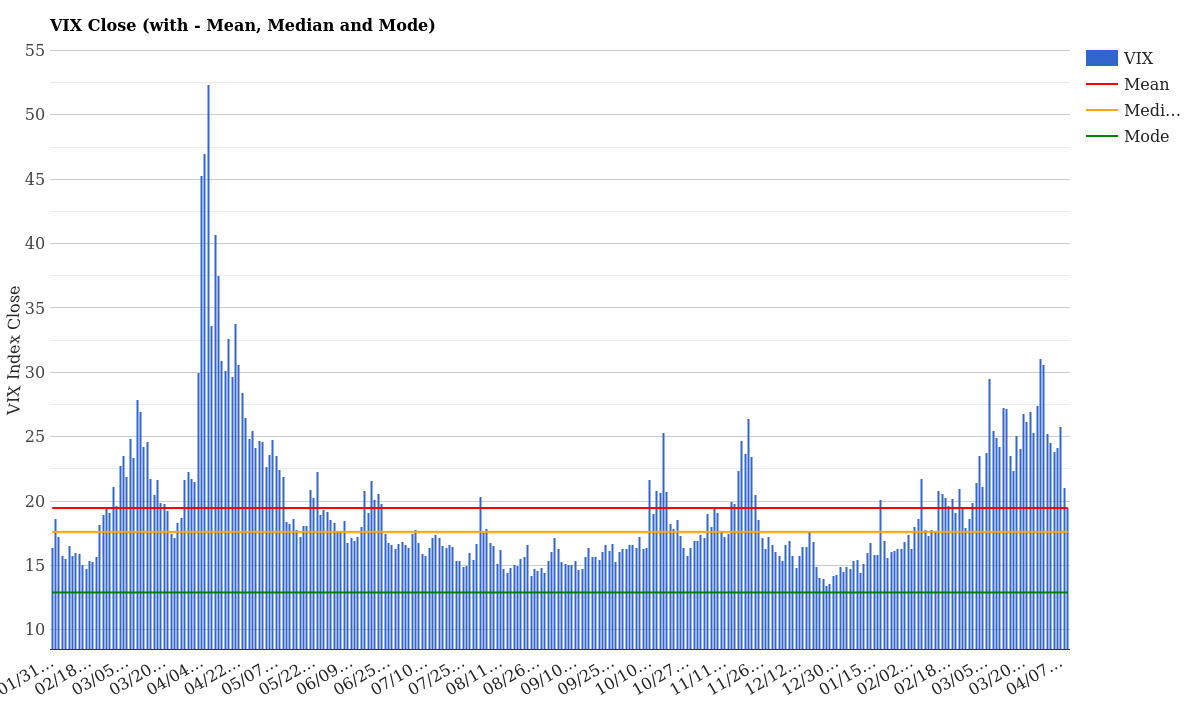
VIX Close with Mean, Median and Mode – April 10, 2026
What the Current VIX Level Means
At 19.49, the VIX sits 0.03 points above its 2-year mean of 19.46, putting today’s reading right at the long-term equilibrium level. For context, this means markets are pricing in slightly elevated but not exceptional anxiety-a far cry from the panic that gripped investors just six trading days ago when the VIX hit 24.49.
Historically, a VIX near 20 represents the boundary between complacency and caution. Below this threshold, traders grow overconfident. Above it, fear begins to creep in. Today’s level suggests the market has found temporary balance.
| Metric | Today (04/09) | Yesterday (04/08) | Change |
|---|---|---|---|
| VIX Close | 19.49 | 21.04 | -1.55 (-7.37%) |
| 5-Day Change | -4.38 | – | -18.35% |
| vs 2-Year Mean | +0.03 | +1.58 | Back to neutral |
| 1-Year Percentile | 40th percentile | – | Below median volatility |
The daily move downward is encouraging news for equity holders. Over the past five days, the VIX has surrendered nearly 4.4 points, erasing most of the fear premium that built up during last week’s turmoil. That retreat to just barely above the mean suggests institutional investors have largely finished their defensive repositioning.
What’s particularly interesting is that today’s level places us at the 40th percentile of 1-year volatility readings. In plain terms: fewer than half of the days in the past year saw lower volatility than we’re experiencing right now. This isn’t a calm market-it’s a market returning to a level traders consider “normal elevated.”
VIX Term Structure: Short-Term vs Long-Term Fear
The term structure of VIX futures reveals how fear is distributed across different time horizons. Today’s curve tells a story of normalizing anxiety.
| Contract | Time Horizon | Today (04/09) | Yesterday | Change |
|---|---|---|---|---|
| VIX9D | 9 days ahead | 16.81 | 19.16 | -2.35 |
| VIX (Spot) | Today | 19.49 | 21.04 | -1.55 |
| VIX3M | 3 months ahead | 21.81 | 22.68 | -0.87 |
| VIX6M | 6 months ahead | 23.39 | 24.02 | -0.63 |
| VIX1Y | 1 year ahead | 24.11 | 24.45 | -0.34 |
Notice the curve structure: 16.81 → 19.49 → 21.81 → 23.39 → 24.11. This is textbook contango, the normal market state where investors expect volatility to gradually rise as they look further into the future. The curve is well-defined and orderly-no spikes, no inversions, no panic signaling.
The most striking feature is the near-term relief. The 9-day VIX sits at just 16.81, more than 2.7 points below the spot VIX. This spread suggests traders believe the immediate danger has passed and expect calmer conditions over the next week or so. However, that optimism fades as you move forward: by the 1-year contract, fear has crept back up to 24.11, reflecting structural uncertainty further out.
For a full explanation of the VIX and how futures work, see our complete VIX guide.
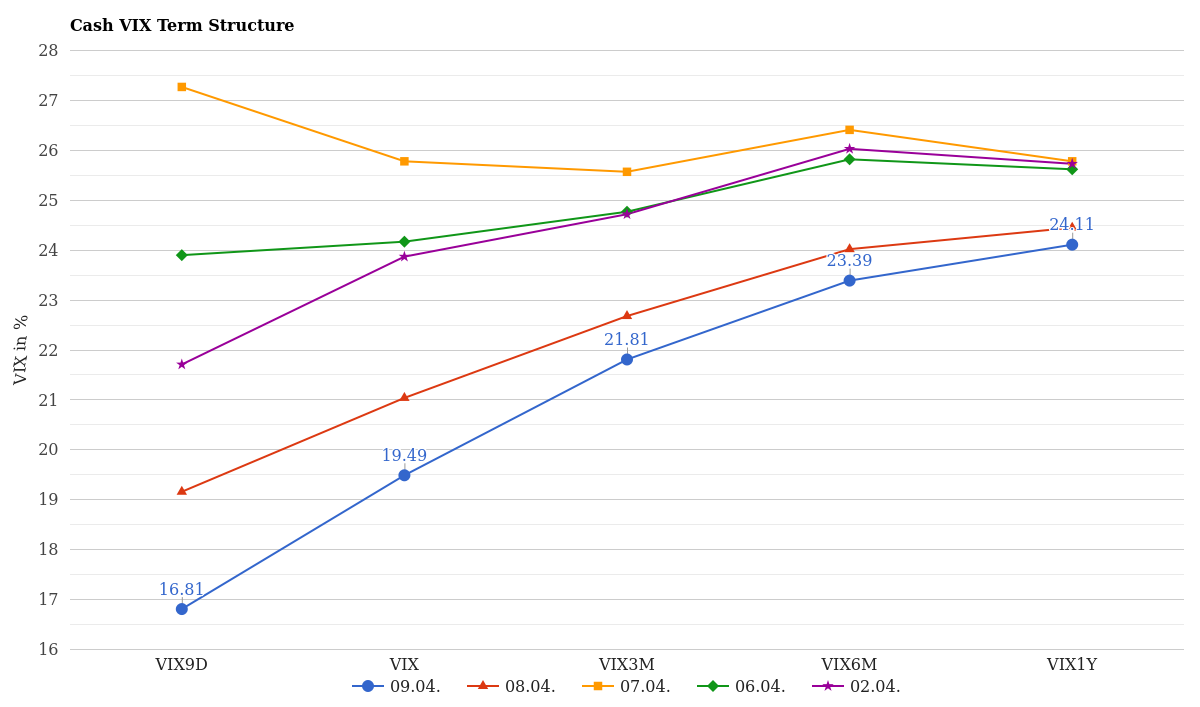
Cash VIX Term Structure (VIX9D to VIX1Y) – Last 5 Days
How Volatility Has Changed This Week
Zooming out to see the weekly trajectory reveals just how volatile volatility itself has been in early April.
| Date | April 2 (Tue) | April 6 (Sun) | April 7 (Mon) | April 8 (Tue) | April 9 (Wed) |
|---|---|---|---|---|---|
| VIX Close | 24.48 | 23.84 | 24.98 | 21.67 | 19.49 |
| Daily Change | – | -0.64 | +1.14 | -3.31 | -1.55 |
Last Tuesday (April 2), the VIX was already elevated at 24.48. By mid-week, fear had peaked slightly higher near 25. But since that modest top, we’ve seen a steady unwinding: Tuesday’s 3.31-point drop marked the turning point, followed by Wednesday’s additional 1.55-point decline.
In percentage terms, the VIX has collapsed 18.35% over five trading days-a significant mean reversion that suggests the catalyst for initial fear (whatever it was) has largely been digested by the market. The cooling has been consistent, not violent, which implies no panic capitulation but rather a methodical shift toward acceptance of current conditions.
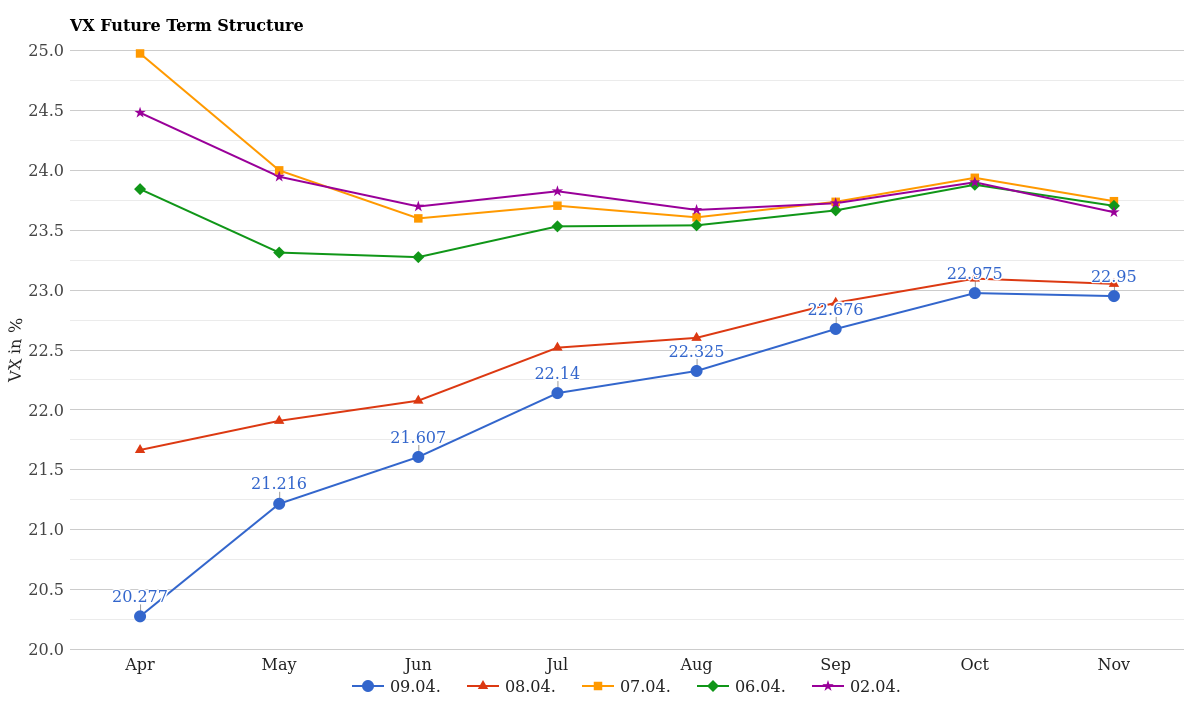
VX Future Term Structure – Last 5 Days
How Rare Is This VIX Level Historically?
Where does a VIX reading of 19.49 stand in the historical record? Let’s examine how often we see volatility at this exact level.
Looking at 1-year frequency data, readings in the 19-20 range (where we sit today) appear 14 times across the past 12 months. That makes today’s level neither rare nor common-it’s squarely in the “normal” zone for moderate volatility environments. Compare that to the mode (most common reading) of 12.90: we’re running about 50% hotter than the most frequently observed volatility level, but well below the disaster thresholds of 25+.
| VIX Range | Days (1 Year) | Days (YTD) | Interpretation |
|---|---|---|---|
| 13-14 | 2 + 23 = 25 | 4 + 7 = 11 | Very calm |
| 19-20 | 17 + 16 = 33 | 5 + 5 = 10 | TODAY’S ZONE |
| 25-26 | 7 + 5 = 12 | 5 + 3 = 8 | Elevated fear |
| 30+ | 2 | 0 | Crisis panic |
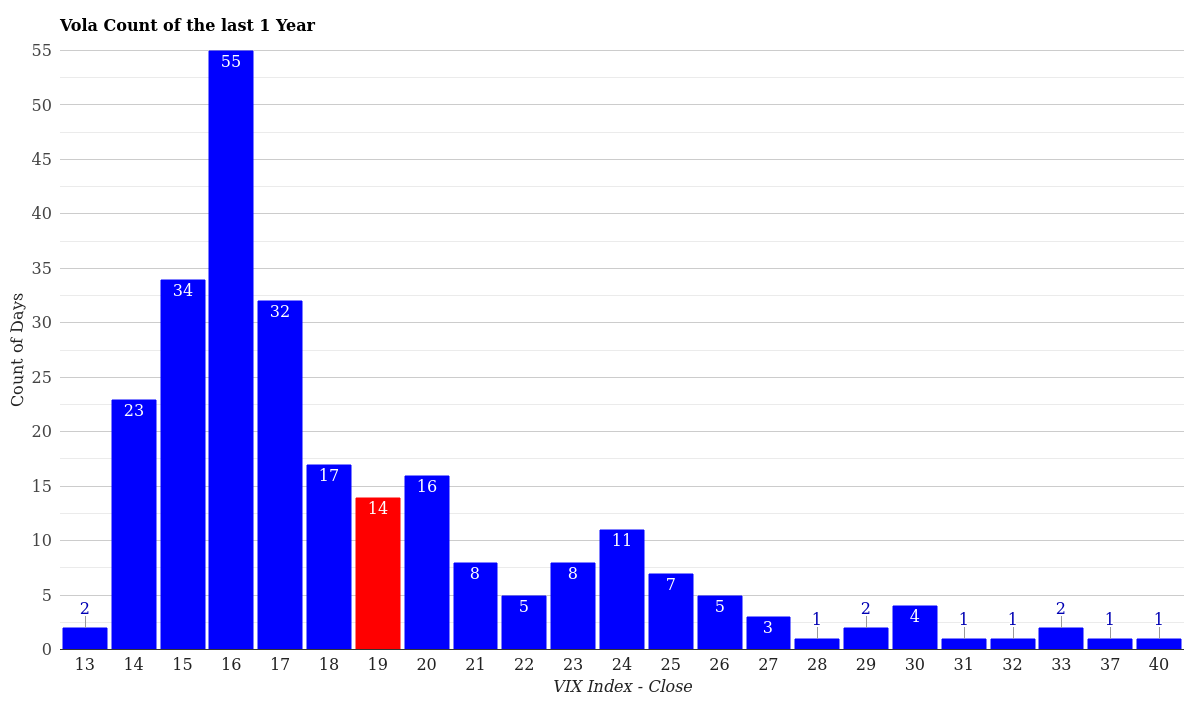
VIX Volatility Distribution – Last 12 Months
Year-to-date, we’ve had similar behavior. The 19-20 range appears 10 times so far in 2026-frequent enough that we should expect this reading, but not so common that it signals excessive complacency. Meanwhile, readings above 30-true crisis territory-have been virtually nonexistent in recent months.
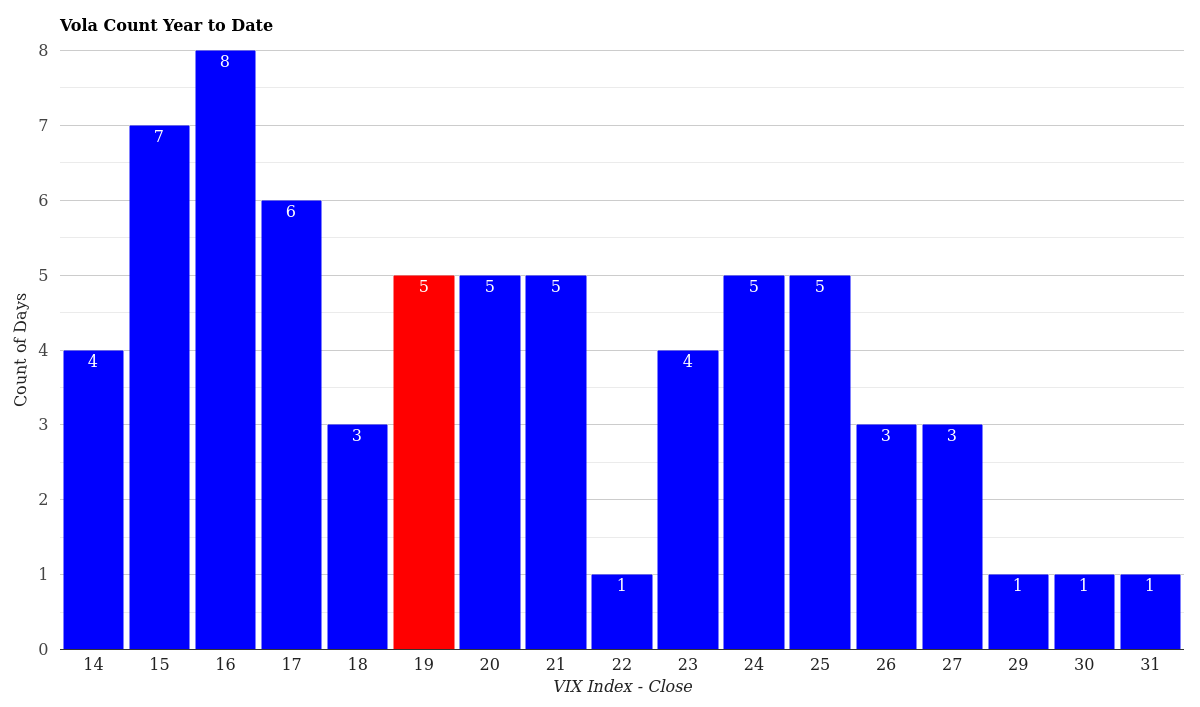
VIX Volatility Distribution – Year to Date
The historical context is reassuring. Today’s VIX level puts us in a zone that appears roughly once every two weeks over a 12-month period. It’s the market saying: “We’re concerned, but we’re not panicking.”
What This Means for Traders Right Now
A VIX around 19.5 with a healthy contango curve creates a specific environment for different trading styles.
For long-term investors: This is actually a decent re-entry point. Volatility is elevated enough to suggest some opportunity premium in equity valuations, but stable enough that you’re not catching a falling knife. If you’ve been holding cash, near-20 VIX readings historically mark attractive entry zones. The upward slope of the term structure suggests the market doesn’t expect an immediate shock, which reduces tail-risk exposure.
For options traders: IV levels around 19-20 sit in the middle of the playbook. Long volatility positions (long straddles, long calls) become less attractive because you’re buying at decent premium levels but not at crisis highs. Short volatility strategies remain viable if you’re comfortable with the risk, particularly in the front-month contracts where the 9-day VIX sits at only 16.81. That 2.7-point spread offers some income opportunity, though it’s not a screaming deal.
Key support and resistance: Watch the 18.50 level below as initial support. If the VIX breaks below that on continued equity strength, you’re looking at a full normalization toward 16-17 range. Resistance sits near 21.50, which would signal renewed concern creeping back in. A move above 25 would indicate a material shift back toward fear-driven positioning.
The term structure tells us the market has priced in minimal near-term shocks. That’s useful information whether you’re managing downside risk or looking to reduce hedges.
Conclusion: Markets Finding Their Footing
The VIX at 19.49 represents a market in transition from heightened anxiety toward renewed equilibrium. Over the past five days, fear has subsided by nearly 18%, bringing volatility back to long-term average levels. The well-formed contango curve and falling near-term VIX contracts suggest traders believe the immediate crisis has passed.
This is neither an all-clear signal nor a warning siren. It’s a moment of balance-the kind of environment where both opportunity and risk exist in roughly equal measure. The lack of negative surprise in the short-term curve is encouraging for equity holders, while the elevated longer-dated contracts remind us that structural uncertainties remain.
Monitor these levels over the coming week: a break below 18 signals full recovery sentiment, while a breach above 22 would suggest the calm is temporary. For detailed historical analysis and past trends, browse our daily VIX reports to see how this episode compares to previous volatility cycles.
Disclaimer: This article is for informational purposes only and does not constitute financial or investment advice. All data is historical and statistical. Past performance is not indicative of future results. The VIX and derivatives are complex instruments subject to rapid change. Always consult a licensed financial advisor before making investment decisions.
Author Disclosure: The author may hold or has held positions in VIX-related instruments directly or through derivative constructs at the time of publication. This is not a trading recommendation. All analysis reflects publicly available data only.
For more market analysis visit stockbotty.com | Disclaimer: stockbotty.com/disclaimer