
VIX at 19.12: Markets Calm After Week of Volatility Spikes
The VIX closed at 19.12 on April 14, 2026, marking a welcome retreat from the elevated readings that dominated early April. Markets are stabilizing, but traders shouldn’t ignore the underlying tensions that sent fear spiking above 50 just two weeks ago. This report breaks down what today’s level means, where volatility might head next, and how this moment fits into the broader market picture.
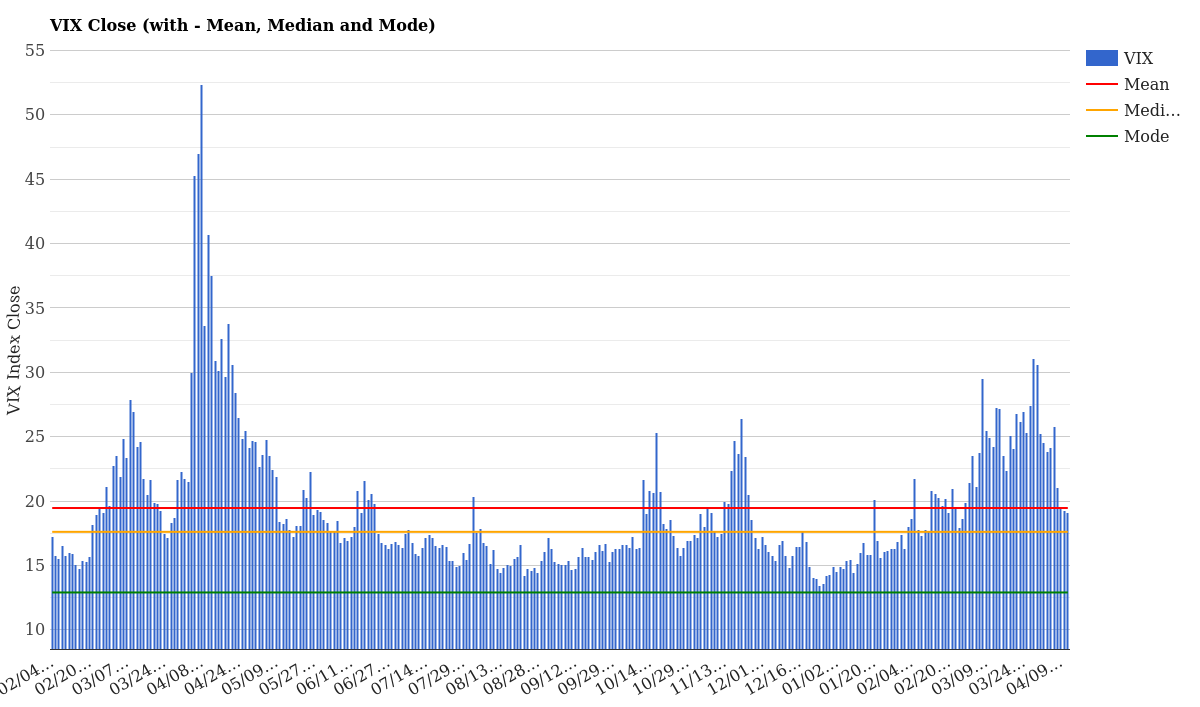
VIX Close with Mean, Median and Mode – April 14, 2026
What the Current VIX Level Means
At 19.12, the VIX sits comfortably below its two-year mean of 19.46, signaling that implied volatility has returned to near-normal territory. This is good news for traders who prefer stability, but the context matters: we’ve only just recovered from readings above 50 in early April. The current level tells us markets have stopped panicking-at least for now.
Historically, a VIX reading of 19 represents what traders call “normal volatility.” It’s not the complacency you’d see in the 12-15 range, but it’s far from the fear that grips markets above 25. Today’s VIX sits 1.88 points above the two-year median of 17.24, placing it at the 40th percentile for the past year-meaning four out of ten trading days have seen lower fear levels.
| Metric | Value | Status |
|---|---|---|
| VIX Today | 19.12 | Below Mean |
| Daily Change | -0.11 (-0.57%) | Slight Decline |
| 5-Day Change | -6.66 (-25.83%) | Strong Recovery |
| 2-Year Mean | 19.46 | Baseline |
| 2-Year Median | 17.24 | Baseline |
| 1-Year Percentile | 40th | Below Average Fear |
Why does this matter? Because the gap between today and the peaks we saw just days ago suggests the immediate trigger for panic has eased. Whether that relief is justified depends on what caused April’s spike in the first place-and whether those concerns have been truly resolved or merely postponed.
VIX Term Structure: Short-Term vs Long-Term Fear
One of the most revealing aspects of volatility markets is the term structure-the curve showing different expiration dates. Today’s structure reveals something important: near-term panic has subsided, but traders remain cautious about the intermediate and longer-term outlook.
| Contract | Expiration | Today | April 10 | Change |
|---|---|---|---|---|
| VIX9D | 9 Days | 17.33 | 16.36 | +0.97 |
| VIX (Spot) | Current | 19.12 | 19.23 | -0.11 |
| VIX3M | 3 Months | 21.34 | 21.86 | -0.52 |
| VIX6M | 6 Months | 23.00 | 23.51 | -0.51 |
| VIX1Y | 1 Year | 23.96 | 24.25 | -0.29 |
Notice the pattern: 17.33 → 19.12 → 21.34 → 23.00 → 23.96. This is what traders call “contango,” meaning longer-dated volatility is higher than near-term volatility. Markets are saying: “We feel better in the next week or two, but we’re worried about what happens six months out.” That’s a rational response when you don’t know if current relief will hold.
The upward slope is moderate, not steep, suggesting traders aren’t panicking about the distant future either. When contango gets aggressive-jumping 5+ points from spot to one year-it signals deeper structural concerns. We’re not there yet, but the curve’s shape deserves attention. For a deeper understanding of how these structures work, see our complete VIX guide.
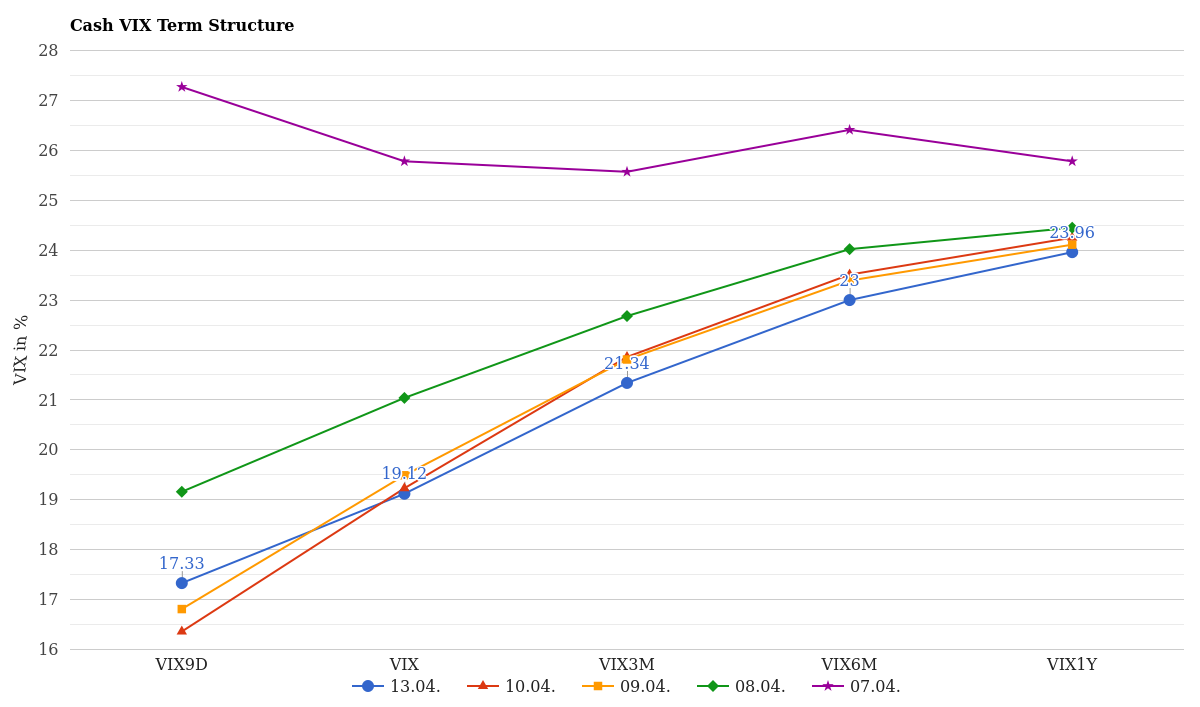
Cash VIX Term Structure (VIX9D to VIX1Y) – Last 5 Days
How Volatility Has Changed This Week
Zooming out to the five-day picture reveals the real story. Over the past trading week, the VIX has fallen 6.66 points (25.83%) from 25.78 on April 7. That’s a sharp decompression-volatility collapsing across all maturities.
| Date | Apr 7 | Apr 8 | Apr 9 | Apr 10 | Apr 14 |
|---|---|---|---|---|---|
| VIX April | 24.98 | 21.67 | 20.28 | 20.41 | 19.30 |
| VIX May | 24.00 | 21.91 | 21.22 | 21.57 | 20.71 |
| VIX June | 23.60 | 22.08 | 21.61 | 21.85 | 21.15 |
Every single maturity declined over this stretch. April futures tumbled nearly 5.7 points, while May and June contracts fell by roughly 3.3 points each. The steepness of these declines speaks to real market relief, not just noise. Whatever spooked traders on April 7 has been at least partially resolved.
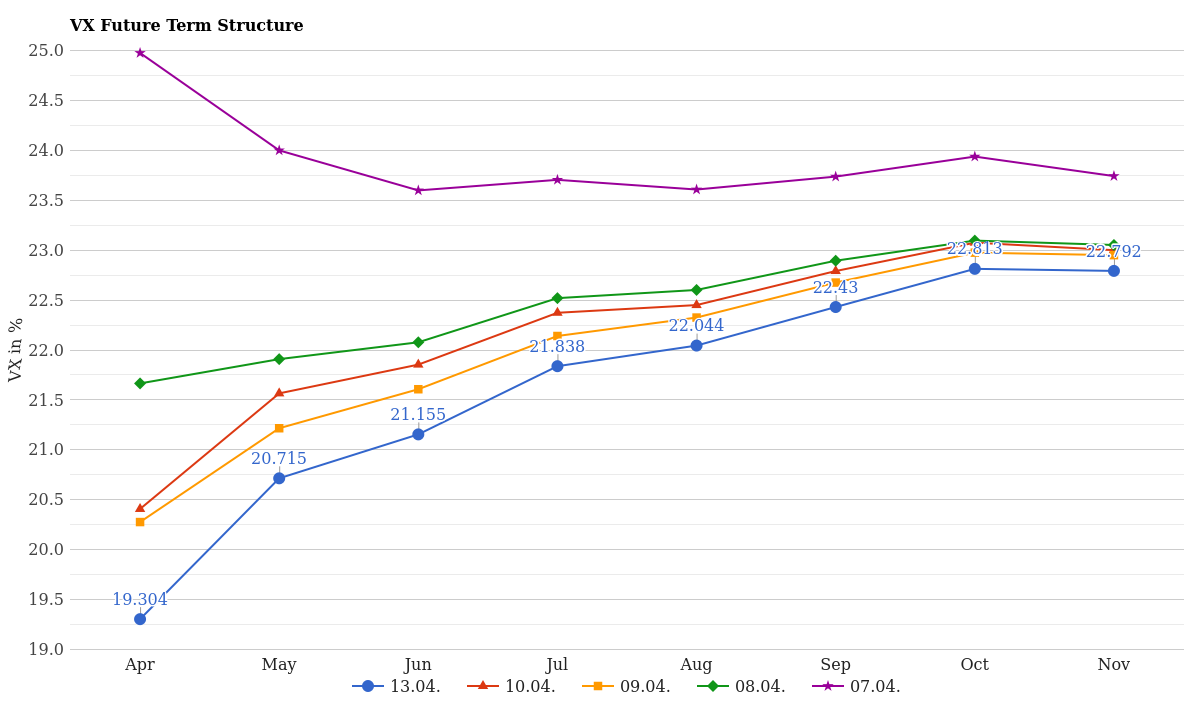
VX Future Term Structure – Last 5 Days
How Rare Is This VIX Level Historically?
Context matters when interpreting volatility. A VIX of 19 feels normal after weeks above 30, but how does it compare to the bigger picture?
Over the past year, volatility has spent most of its time in a relatively tight band. The volacount data shows that readings between 14-17 have occurred 55 times-by far the most common range. The 19-20 range where we sit today has occurred 16 times, making it moderately common. The truly elevated levels above 30 are rare: only 23 instances in the 12-month period, with readings above 40 appearing just a handful of times.
Year-to-date, we’re even more skewed toward volatility expansion. The 19-20 range has shown up 7 times since January 1, while readings in the dangerous 40+ territory have occurred multiple times during April’s spikes. This tells us 2026 has been unusually volatile compared to the full two-year record.
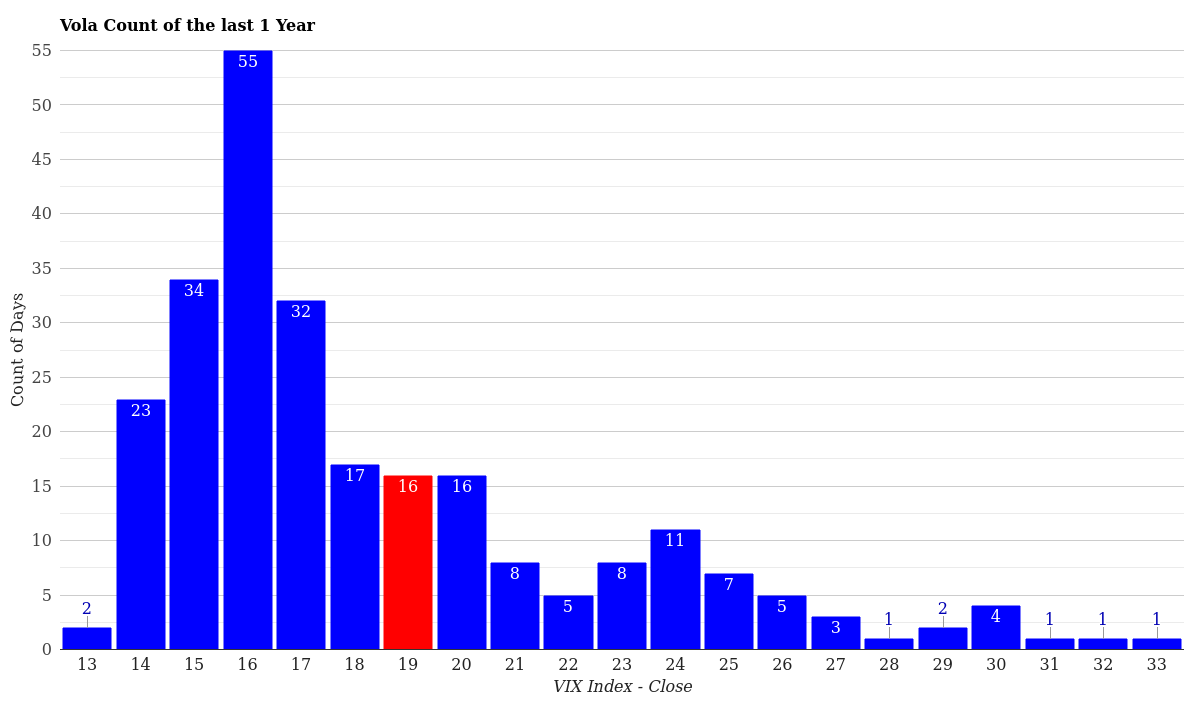
VIX Volatility Distribution – Last 12 Months
Put simply: today’s level is normal by two-year standards but represents a significant calming from the turbulent start to this month. We’re back in familiar territory, but the memory of extremes remains recent enough to keep traders cautious.
What This Means for Traders Right Now
For option sellers, this environment presents a classic dilemma. The 25% decline in volatility over five days means any short volatility positions established last week are now profitable. But the term structure-with longer-dated contracts still priced at 23-24-suggests that calm may be temporary. Selling too aggressively near these levels risks being caught when the next wave of fear arrives.
Buyers of protection (long call spreads, put spreads) face the opposite challenge. Volatility is cheaper than it was five days ago, making premium collection attractive. However, the intermediate-term curve sitting 4+ points above spot suggests market makers expect future volatility to widen again. Risk-reward for buying premium is improving but not yet attractive enough to be obvious.
Key levels to monitor: If the VIX holds above 17 (the two-year median), markets are saying there’s legitimate uncertainty ahead-not panic, but also not complacency. A break below 15 would signal real confidence has returned. On the upside, a recapture of 25 would confirm that early April’s spike wasn’t fully resolved. Watch the April contract closely; if it decouples sharply from the spot VIX, roll risk emerges.
Conclusion & Market Outlook
The VIX at 19.12 represents a market taking a breath after significant stress. The 25.8% decline this week is real, and the term structure suggests traders believe calm will hold in the near term. However, the moderate upward slope in the futures curve tells us the underlying issues that caused April’s volatility spike haven’t disappeared-they’ve just been temporarily shelved.
For the week ahead, expect volatility to remain in the 17-21 range unless a fresh catalyst emerges. The gap between current levels and the longer-dated contracts gives hedgers decent value, while outright short volatility positions should wait for either more confirmation of calm or a better entry point. Browse our daily VIX reports for historical context and follow-up analysis as markets evolve.
For more market analysis visit stockbotty.com | Disclaimer: stockbotty.com/disclaimer