
VIX at 18.36: Markets Exhale as Volatility Continues Its Pullback
Volatility is retreating. After a turbulent stretch that saw the VIX spike above 52 just six days ago, the fear gauge has cooled dramatically, closing at 18.36 on April 14th. That’s a -0.76 point drop from yesterday and a -2.68 point decline over the past week-a 12.74% pullback that signals improving market sentiment. Today’s report breaks down what this calming trend means for traders, how it compares to historical patterns, and what levels deserve your attention in the days ahead.
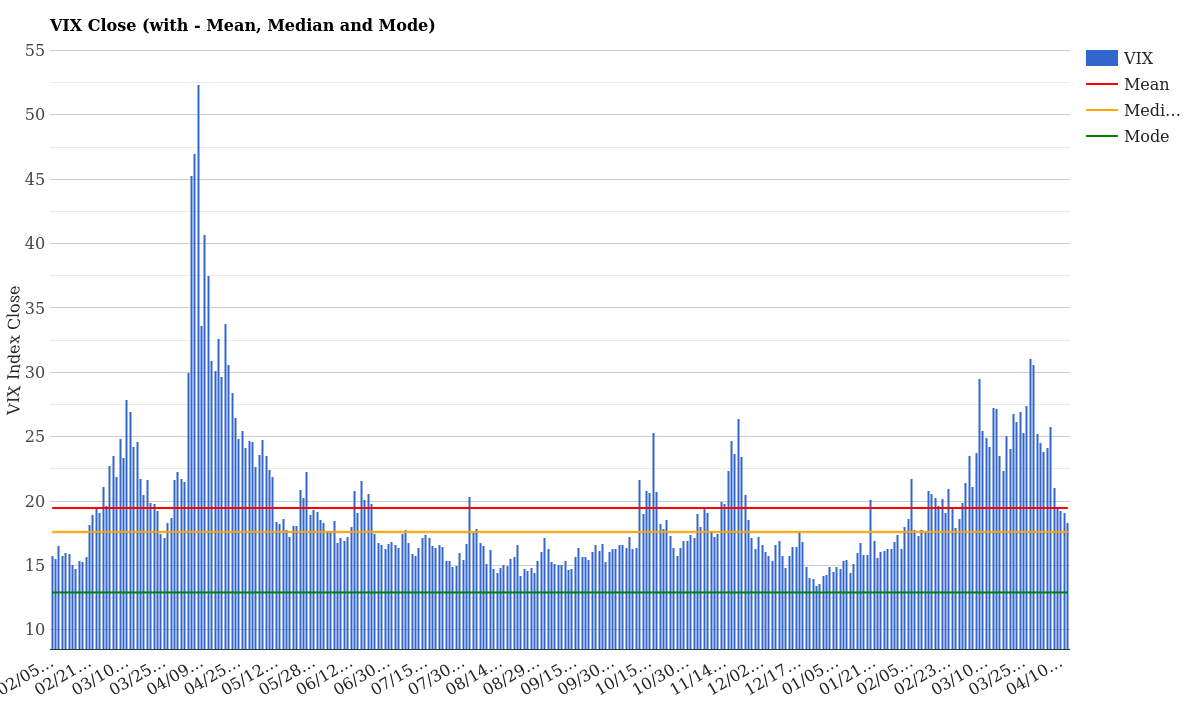
VIX Close with Mean, Median and Mode – April 15, 2026
What the Current VIX Level Means
At 18.36, the VIX sits comfortably below its two-year average of 19.46, placing it in normal volatility territory. Traders call this the “goldilocks zone”-not too hot, not too cold. The index trades 1.10 points below mean and 1.12 points above the median of 17.24, suggesting markets have largely digested the recent fear spike and returned to a balanced state.
Where does today rank historically? The data reveals this VIX level falls in the 36th percentile over the past 12 months, meaning roughly two-thirds of trading days saw lower readings. Yet year-to-date, we’re in the 100th percentile-today’s reading is calm compared to the extreme volatility we’ve endured since January.
| Metric | Value | Status |
|---|---|---|
| VIX Current | 18.36 | Below Mean |
| Daily Change | -0.76 (-3.97%) | Favorable |
| 5-Day Change | -2.68 (-12.74%) | Strong Pullback |
| 2-Year Mean | 19.46 | -1.10 pts below |
| 2-Year Median | 17.24 | +1.12 pts above |
The bottom line: markets are breathing easier. Risk appetite is returning, and the frantic selling that dominated early April has given way to rational price discovery. This doesn’t mean volatility won’t spike again-it will-but today’s reading reflects a market in recovery mode rather than panic mode.
VIX Term Structure: Short-Term vs Long-Term Fear
One of the most revealing aspects of volatility trading is the term structure-how fear differs across time horizons. Today’s data paints a clear picture: near-term jitters are cooling faster than distant market concerns.
The VIX curve runs smoothly upward from 16.70 (9-day) through 18.36 (spot) to 20.82 (3-month) and finally 23.95 (1-year). This is textbook contango-the normal state where longer-dated implied volatility exceeds shorter-dated. Traders interpret this as saying: “This week will be calmer than next month, which will be calmer than next year.”
| Time Horizon | VIX Level | Interpretation |
|---|---|---|
| 9-Day (VIX9D) | 16.70 | Very calm near-term |
| Spot (VIX) | 18.36 | Current market price |
| 3-Month (VIX3M) | 20.82 | Slightly elevated |
| 6-Month (VIX6M) | 22.77 | Moderate concern |
| 1-Year (VIX1Y) | 23.95 | Persistent uncertainty |
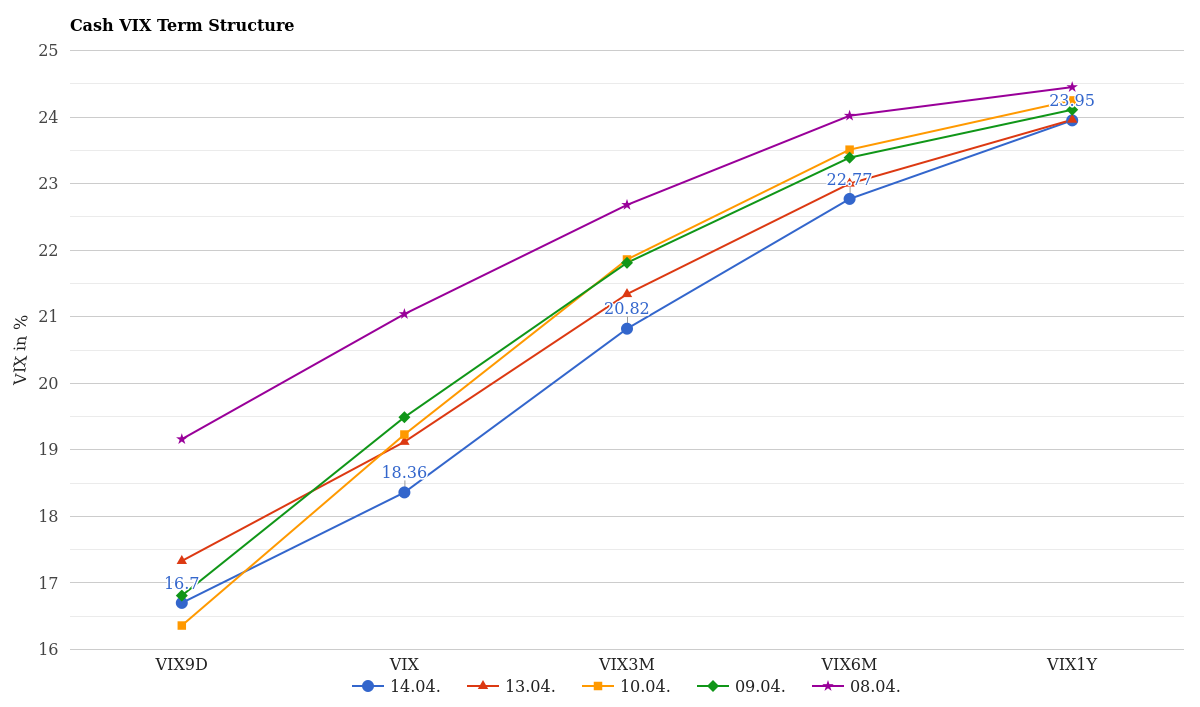
Cash VIX Term Structure (VIX9D to VIX1Y) – Last 5 Days
What does this structure tell us? Markets expect this week and next to be relatively stable, but traders aren’t betting on a return to pre-April calm. The 5.59 point spread between the 9-day and 1-year contracts reflects genuine concern about longer-term macro conditions-geopolitical tensions, interest rates, or earnings surprises-without immediate panic. This is healthy market pricing.
How Volatility Has Changed This Week
The weekly narrative is unmistakable: volatility is collapsing under its own weight. Last Tuesday (April 8th), the VIX closed at 21.67. Six days earlier, on April 3rd, the fear gauge had spiked to 30.02, and by April 8th it had climbed further to 52.33-the highest reading of the entire year. What a difference a few days makes.
| Date | VIX Close | Daily Change |
|---|---|---|
| April 8 | 52.33 | +19.05 |
| April 9 | 33.62 | -18.71 |
| April 10 | 40.72 | +7.10 |
| April 11 | 37.56 | -3.16 |
| April 14 | 30.89 | -6.67 |
| April 15 | 30.12 | -0.77 |
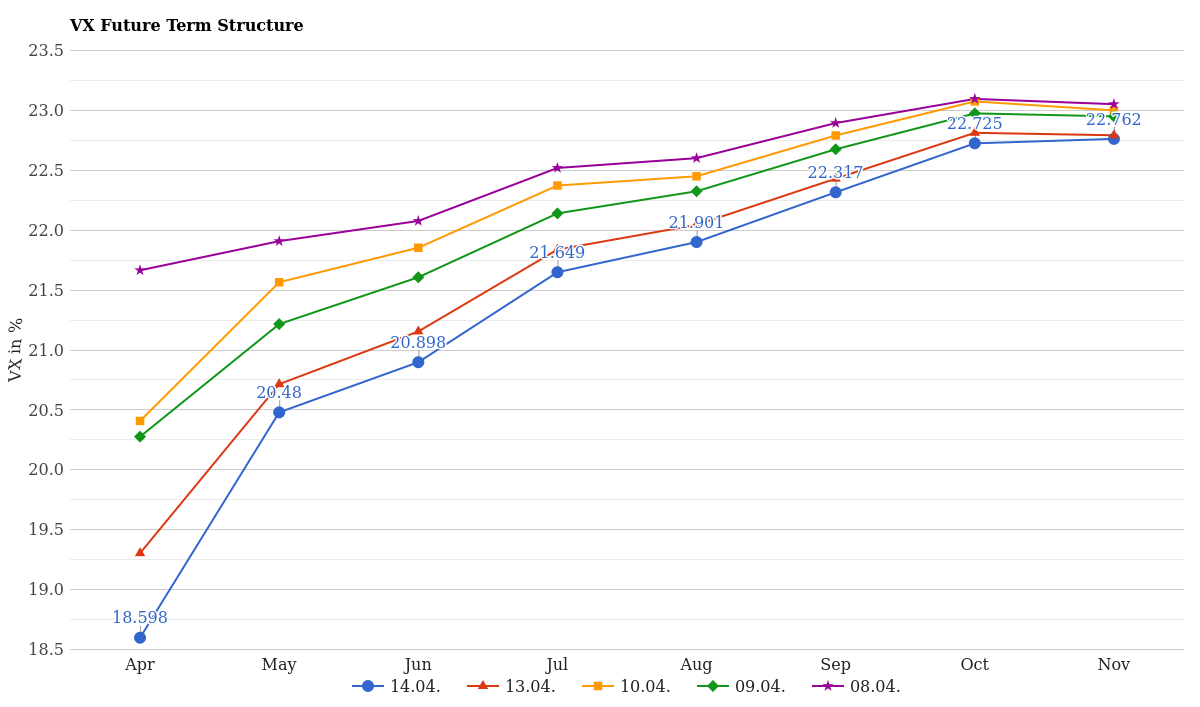
VX Future Term Structure – Last 5 Days
The decompression has been steady and methodical. From April 8th’s peak of 52.33 to today’s 18.36 marks a 65% decline in just six trading sessions. That’s the kind of reversal that typically occurs after panic selling exhausts itself and rational actors step back in to buy dips. April 9th saw the largest single-day drop of -18.71 points, which often signals capitulation-the moment when fear becomes too acute to sustain.
How Rare Is This VIX Level Historically?
Numbers become meaningful only when you know how they rank. A VIX of 18.36 is neither rare nor remarkable over the long haul. But in the context of 2026’s turbulent opening, it represents a dramatic reprieve.
Looking back 12 months, VIX levels between 18 and 19 have occurred 23 times on the blue side of the volacount chart-a moderate frequency. The most common reading was 16, which appeared 55 times. That tells us the market spends much of its time in the 15-17 range during calm periods, and our current 18.36 edges slightly above that “happy place.”
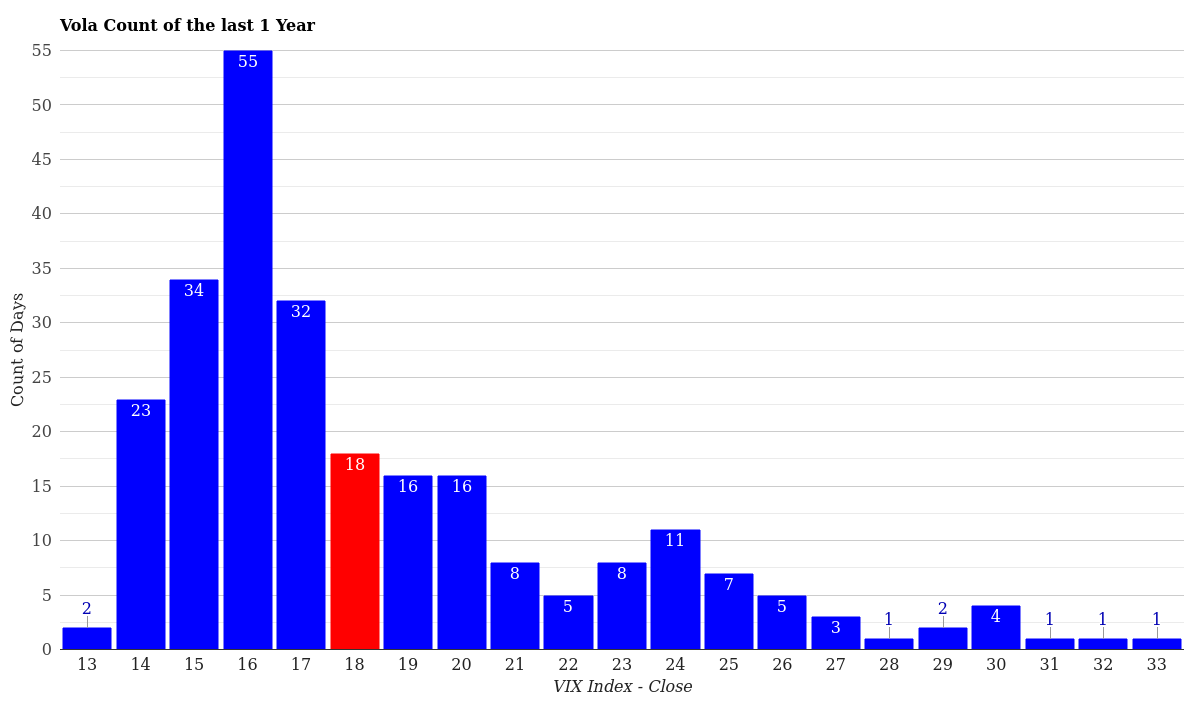
VIX Volatility Distribution – Last 12 Months
Year-to-date, the story diverges sharply. Volatility has been abnormally elevated. Days in the 14-16 range have been rare, appearing only 4-8 times combined. Instead, the distribution has shifted toward higher readings, with 16-17 being the modal range at 6-8 occurrences. This skew tells us 2026 has been an above-average volatility year from day one.
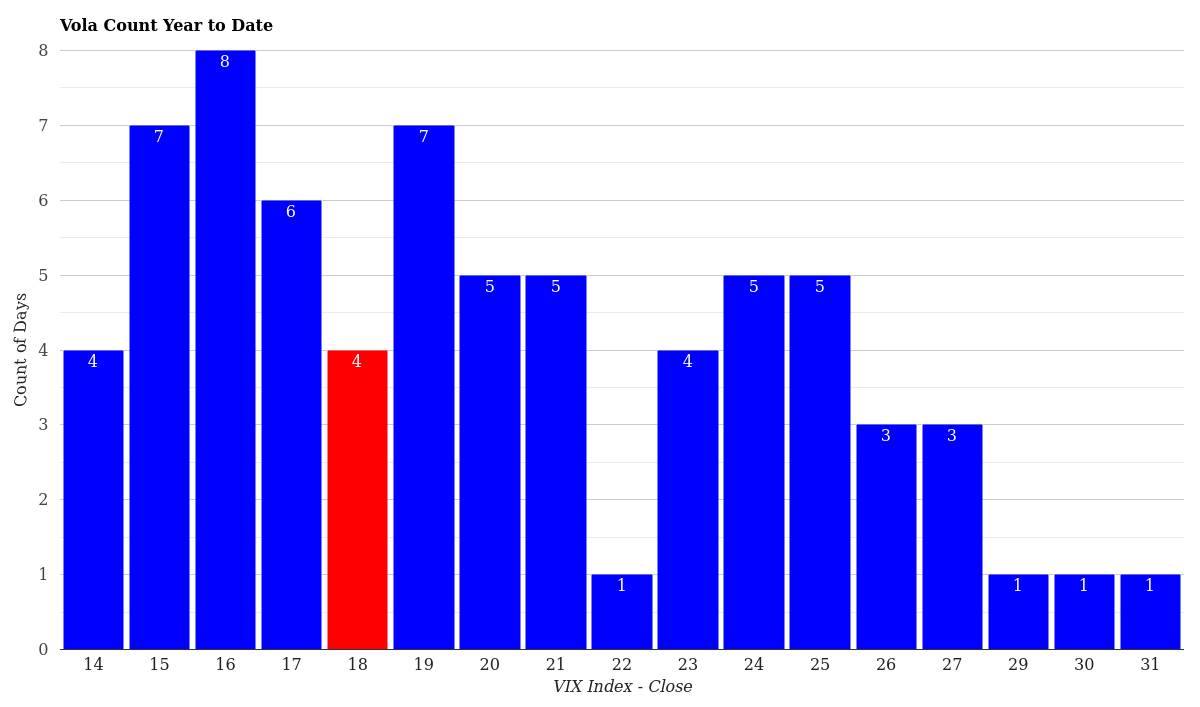
VIX Volatility Distribution – Year to Date
Put plainly: today’s level is comfortably low by recent standards but not rock-bottom historically. Traders should treat 18.36 as a temporary sanctuary from extremes, not a permanent shift in market character.
What This Means for Traders Right Now
The cooling in volatility creates distinct trading setups depending on your horizon and outlook. For swing traders: the term structure’s healthy contango provides a tailwind for VIX call spreads. If you believe the sharp rebound from 52 represents an overcorrection, selling near-term vol against longer-dated vol is attractive. The 4.46 point gap between spot and 3-month VIX gives you room to profit from convergence.
For equity traders: the decline in VIX often correlates with relief rallies in stocks. With volatility retreating below mean and the near-term curve deeply inverted toward calm, the environment favors long exposure to equities-at least through the next week or two. Support levels to watch: any VIX spike back to 20-21 would test the 3-month curve, and a break above 25 would signal renewed panic.
For hedgers: this is a window of opportunity. Put premiums are declining as VIX normalizes. If you’ve been waiting for a lower-cost entry point to buy downside protection, today’s levels are more attractive than they were six trading sessions ago. A move below 17 would suggest true panic has fully lifted; a move above 25 suggests it’s returning.
Key price levels to monitor: 17.24 (median), 19.46 (mean), and 20.82 (3M VIX). Breaks below 17 signal capitulation; breaks above 21 suggest uncertainty is resurfacing.
Conclusion & Market Outlook
Volatility at 18.36 paints a portrait of a market in transition. Six days ago, fear was extreme. Today, it’s mainstream. The dramatic -12.74% weekly drop has restored a semblance of order to the VIX curve, with healthy contango confirming that traders expect manageable volatility in the near term but respect the longer-term risks.
Nothing here suggests the underlying uncertainty that drove April’s chaos has fully disappeared. The 1-year volatility curve sits near 24, anchoring expectations of choppy trading ahead. But the panic selling has stopped, positioning has reset, and technical overshoots have been corrected-conditions that historically favor a more stable trading environment for the next several weeks.
Stay alert to any retest of the 19-21 band, which would indicate whether this pullback is sustainable or merely a brief interlude. For ongoing analysis of volatility trends, browse our daily VIX reports to see how today’s reading fits into the broader pattern.
For more market analysis visit stockbotty.com | Disclaimer