
VIX at 18.17: Markets Cooling After March Volatility Spike
The VIX currently stands at 18.17, representing a modest decline of -0.19 points (-1.03%) from yesterday’s close. After an explosive March that saw volatility spike well above 30, we’re witnessing a gradual return to more normalized fear levels. This report breaks down what today’s reading means for your portfolio and reveals whether this calm is likely to stick around.
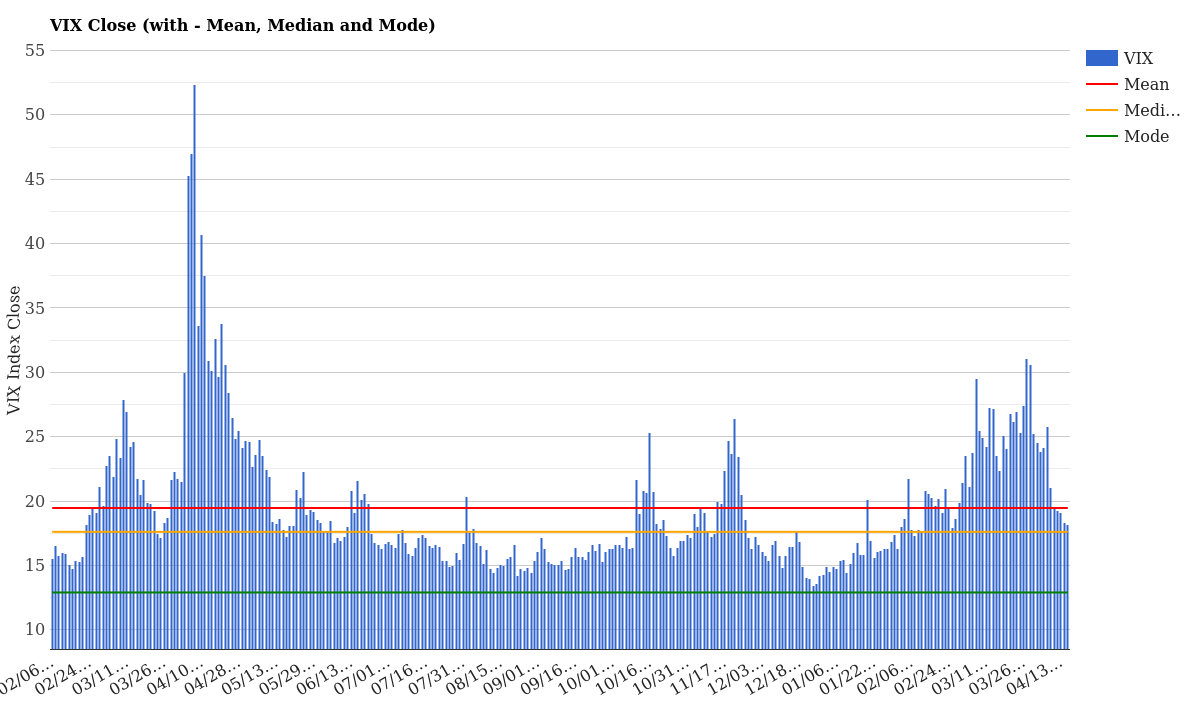
VIX Close with Mean, Median and Mode – April 16, 2026
What the Current VIX Level Means
At 18.17, the VIX sits firmly in the “normal volatility” zone-below the two-year historical mean of 19.46 but above the median of 17.24. In practical terms, this means the market is pricing in moderate anxiety about future price swings, not panic buying of put options.
Compared to today’s historical baselines, you’re looking at a day where fear is slightly elevated but definitely not alarming. The reading sits at the 35.5th percentile over the past year, indicating that roughly two-thirds of trading days have seen lower volatility readings.
| Metric | Value | Interpretation |
|---|---|---|
| VIX Close | 18.17 | Below mean, approaching normal |
| Daily Change | -0.19 (-1.03%) | Slight improvement in market sentiment |
| 5-Day Change | -1.32 (-6.77%) | Sustained weekly downtrend in fear |
| vs. 2-Year Mean | -1.29 | Calmer than average day |
| 1Y Percentile | 35.5% | Below-average volatility relative to past year |
For a full explanation of how the VIX works and why it matters, check out our complete VIX guide.
VIX Term Structure: Short-Term vs Long-Term Fear
One of the most revealing aspects of volatility analysis is the VIX futures curve-essentially what the market expects fear to be at different points in the future. Today’s structure reveals an interesting picture:
| Contract | Today | Yesterday | Timeframe |
|---|---|---|---|
| VIX9D | 16.01 | 16.70 | Next 9 days |
| VIX (Spot) | 18.17 | 18.36 | Current (spot) |
| VIX3M | 20.78 | 20.82 | 3 months out |
| VIX6M | 22.84 | 22.77 | 6 months out |
| VIX1Y | 24.02 | 23.95 | 12 months out |
The curve slopes sharply upward-a classic contango structure. This means traders expect volatility to gradually increase as we move further into the future. Near-term anxiety has cooled considerably (VIX9D at 16.01), but longer-dated expectations remain elevated at 24.02 for the one-year contract.
Why does this matter? It signals that while today’s markets feel relatively calm, there’s persistent concern about trouble brewing in the medium to longer term. This could reflect expectations around earnings season, geopolitical uncertainty, or macro economic adjustments that haven’t hit yet.
Cash VIX Term Structure (VIX9D to VIX1Y) – Last 5 Days
How Volatility Has Changed This Week
Looking at the cash VIX index curve across the past week reveals a clear downtrend in expected volatility across all expiration months:
| Expiry | Apr 15 | Apr 14 | Apr 13 | Apr 10 | 5-Day Change |
|---|---|---|---|---|---|
| April | 17.38 | 18.60 | 19.30 | 20.41 | -3.03 |
| May | 20.59 | 20.48 | 20.71 | 21.57 | -0.98 |
| June | 21.08 | 20.90 | 21.15 | 21.85 | -0.77 |
| July | 21.71 | 21.65 | 21.84 | 22.37 | -0.66 |
Every single expiration month has retreated over the past five days, with April contracts showing the most dramatic improvement-down 3.03 points. This breadth across the curve is encouraging for those who feared March’s spike might persist.
VX Future Term Structure – Last 5 Days
How Rare Is This VIX Level Historically?
To understand whether 18.17 is remarkable or routine, we need to look at the historical frequency of volatility levels. Here’s how today compares to the past year and 2026 year-to-date:
| VIX Range | 1-Year Frequency | YTD Frequency | Rarity |
|---|---|---|---|
| 14-15 | 7 days | 5 days | Uncommon |
| 16-17 | 55 days | 8 days | Common |
| 18-19 | 32 days | 6 days | Moderate |
| 20+ | 79 days | 17 days | Fairly common |
Our current 18.17 reading sits right at the boundary between “moderate” and “common” territory. Looking back over the past year, the VIX has closed between 18-19 only 32 times-about once every two weeks on average. So today’s level is normal enough that it shouldn’t trigger alarm bells, yet elevated enough that it reflects lingering caution.
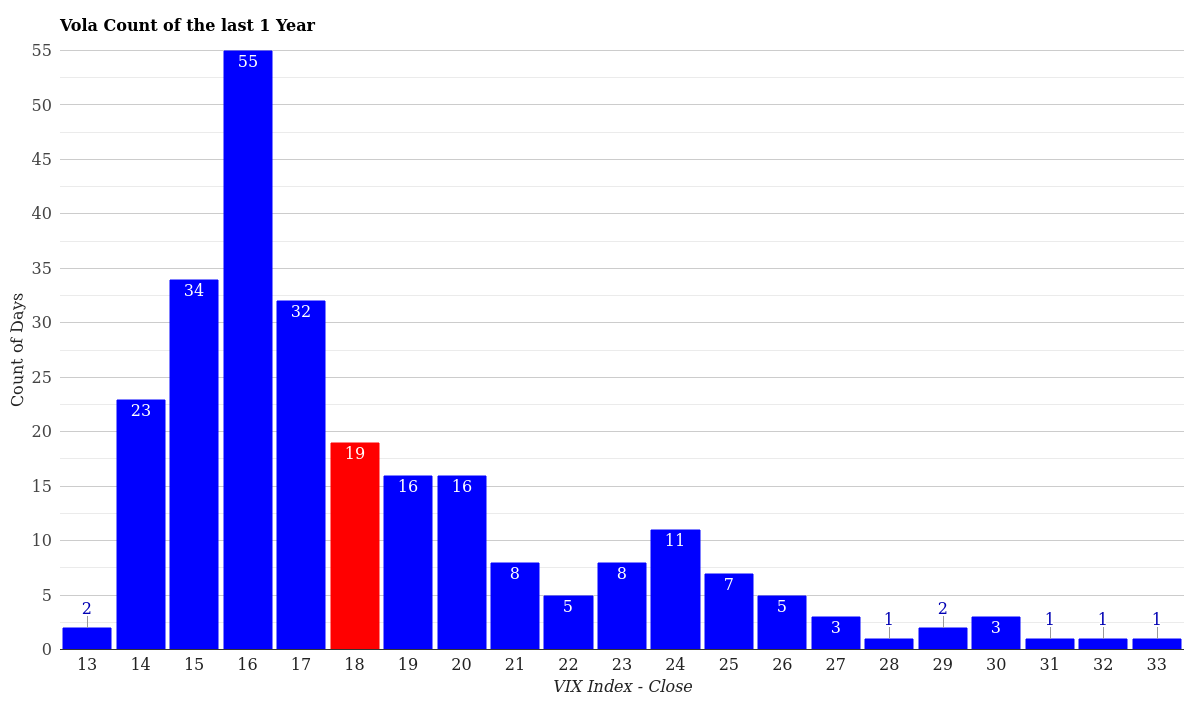
VIX Volatility Distribution – Last 12 Months
What really stands out is the year-to-date picture. The 100.0% YTD percentile means every single trading day in 2026 has experienced lower or equal volatility. This dramatically illustrates how far we’ve climbed from the tranquility of January and early February, when the VIX hovered in the 14-15 range consistently.
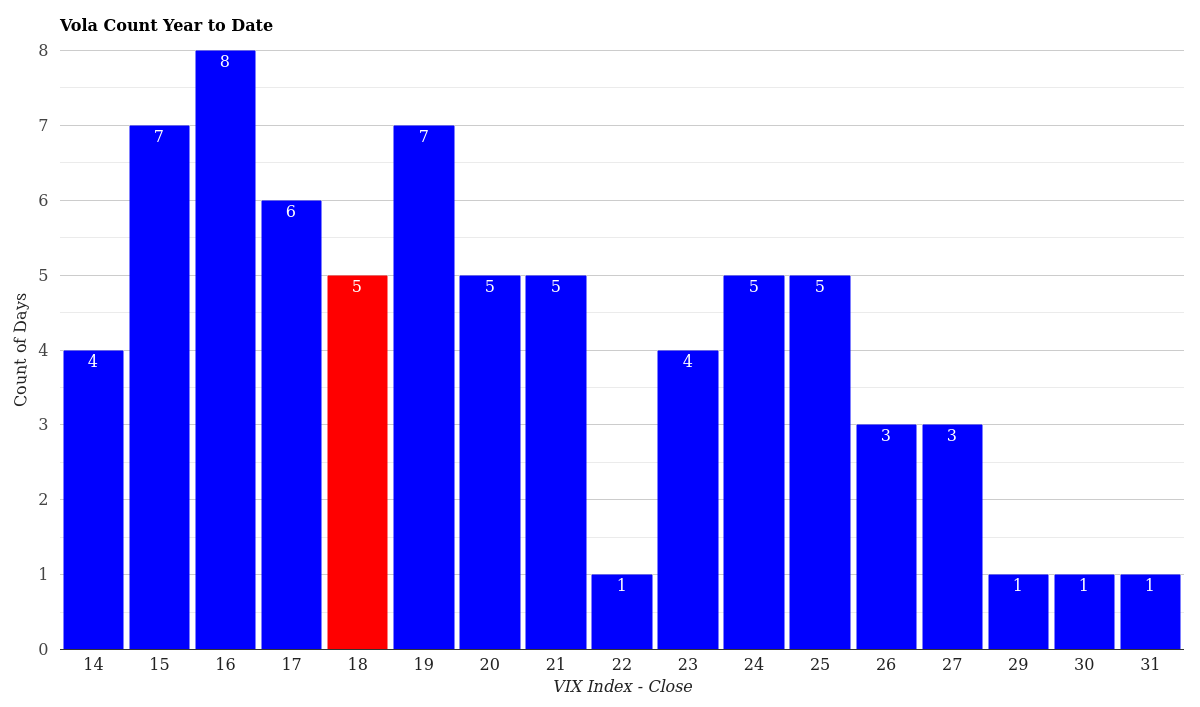
VIX Volatility Distribution – Year to Date
What This Means for Traders Right Now
Current market conditions favor cautious optimism with elevated caution. The downtrend from March’s spike is real and measurable, but it’s plateauing around the 17-20 range rather than crashing back to 12-14 territory we saw last winter.
Several key implications emerge from today’s data. First, options traders should recognize that implied volatility premium has normalized somewhat, making both long and short volatility strategies less extreme than they were two weeks ago. Second, the pronounced contango curve suggests that longer-dated hedges are expensive relative to near-term protection-a trade-off worth considering if you’re building portfolio insurance. Third, the fact that volatility remains meaningfully elevated year-to-date despite April’s recovery underscores that something has fundamentally shifted in market psychology.
For swing traders, the technical picture suggests support forming around the 17-17.5 level (where VIX9D now resides), while resistance appears to be 20-21 range. Watch for whether the contango curve continues to flatten-a sign of growing confidence-or steepens further-a warning sign of deteriorating sentiment at longer horizons.
Conclusion & Market Outlook
At 18.17, the VIX has cooled meaningfully from March’s frightening extremes above 50, yet remains well above the historical median of 17.24. Today’s -1.03% daily move continues a healthy downtrend that began last week, signaling gradual restoration of investor confidence.
The term structure reveals a market that feels okay about the next two weeks but remains nervous about the months ahead. That’s a healthy, calibrated fear that reflects real uncertainties without descending into panic. Most traders should interpret this environment as an opportunity to reassess positioning rather than a signal of immediate danger or explosive upside.
For ongoing context on how volatility evolves, browse our daily VIX reports to track patterns and build your own volatility intuition over time.
This article is for informational purposes only and does not constitute financial or investment advice. All data presented is historical and statistical in nature. Past volatility levels and market behavior are not indicative of future results. VIX readings, futures curves, and percentile analyses are tools for understanding market sentiment-they are not predictive of future price movements. Before making any trading or investment decision, consult with a qualified financial advisor. The author and stockbotty.com assume no liability for decisions made based on this content.
The author may hold or has held positions in VIX-related instruments, equity index futures, or volatility derivative constructs directly or through fund structures at the time of publication. This analysis is educational and should not be construed as a trading recommendation or endorsement of any specific strategy. Individual risk tolerance and time horizon vary significantly-positions suitable for professional traders may be inappropriate for retail investors.
For more market analysis visit stockbotty.com | Disclaimer