
VIX at 17.94: Volatility Cooling as Markets Find Stability
The VIX currently stands at 17.94, down 0.23 points from yesterday and marking a 6.71% decline over the past five trading days. After weeks of elevated market anxiety, today’s reading suggests that fear is gradually retreating from equity markets. In this report, we’ll break down what this level means for traders, how the volatility curve is positioned, and whether this calm is likely to persist.
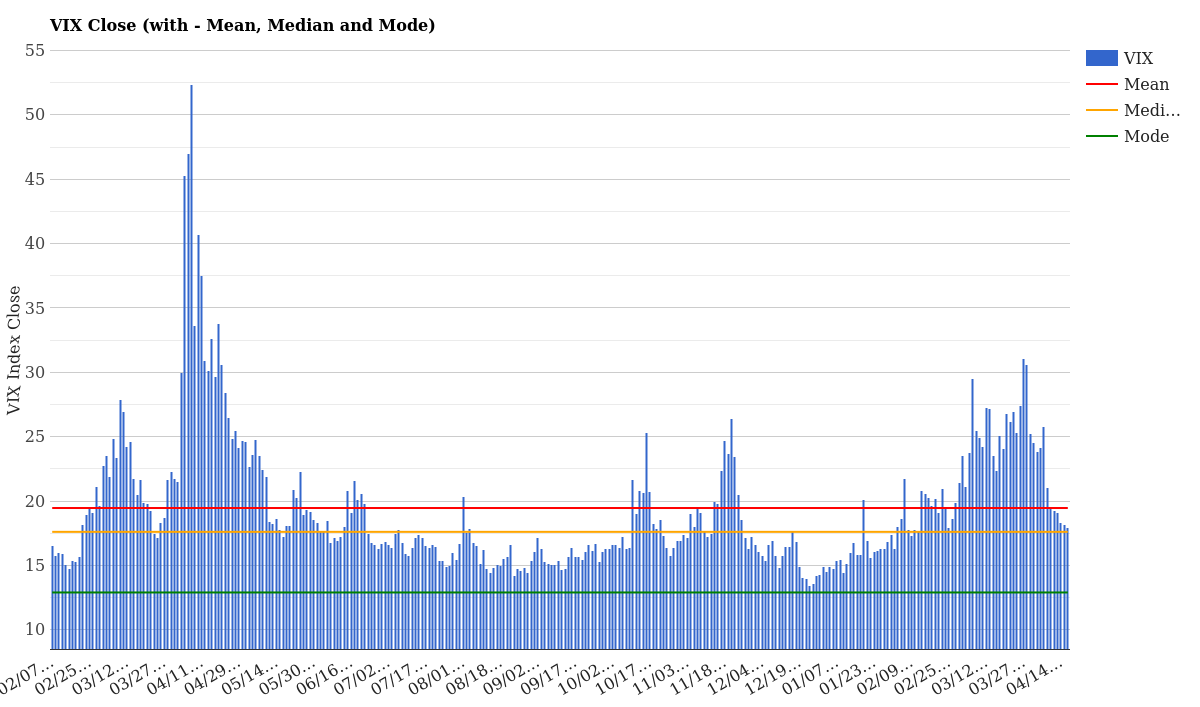
VIX Close with Mean, Median and Mode – April 17, 2026
What the Current VIX Level Means
At 17.94, the VIX is sitting comfortably below its two-year mean of 19.46. This puts today’s reading in the “normal volatility” zone-a far cry from the panic levels we saw just two weeks ago when the index spiked above 50. For context, readings below 20 typically indicate that traders are pricing in a relatively calm market environment with modest expectations for price swings.
| Metric | Value | Status |
|---|---|---|
| VIX Today | 17.94 | Below Mean |
| vs 2Y Mean | -1.52 (-7.8%) | Favorable |
| vs 2Y Median | +0.70 (+4.1%) | Slightly Elevated |
| Daily Change | -0.23 (-1.27%) | Declining |
| 1Y Percentile | 27.3% | Lower End |
What’s particularly interesting is that while today’s VIX is below the mean, it’s still slightly above the two-year median of 17.24. This suggests we’re in a transitional phase-volatility has stepped down from crisis levels but hasn’t quite returned to the “sleepy market” territory that traders experienced earlier this year. For a full explanation of what these metrics mean, check out our complete VIX guide.
In the grand scheme of 2026, a reading of 17.94 ranks at the 27.3% percentile over the past year, meaning roughly three-quarters of trading days have seen even lower volatility. However, on a year-to-date basis, we’re at the 100th percentile-a stark reminder of just how volatile this year has been compared to the muted environment we enjoyed in late 2025.
VIX Term Structure: Short-Term vs Long-Term Fear
Understanding the shape of the volatility curve tells us how fear is distributed across different time horizons. Today’s term structure reveals something reassuring for equity bulls: a healthy contango pattern extending from the near-term out to one year.
| Expiration | Today (04/16) | Yesterday (04/15) | Change |
|---|---|---|---|
| VIX 9-Day | 15.46 | 16.01 | -0.55 |
| VIX Spot | 17.94 | 18.17 | -0.23 |
| VIX 3-Month | 20.77 | 20.78 | -0.01 |
| VIX 6-Month | 22.78 | 22.84 | -0.06 |
| VIX 1-Year | 23.94 | 24.02 | -0.08 |
Cash VIX Term Structure (VIX9D to VIX1Y) – Last 5 Days
Notice how volatility rises as you move forward in time: 15.46 (9-day) progresses steadily upward to 23.94 (1-year). This contango structure is the market’s way of saying “I’m calmer today than I expect to be later.” Traders are pricing in higher uncertainty as we move deeper into the year, which is perfectly normal. The 8.48-point spread between the 9-day and 1-year contracts is reasonable and reflects natural market dynamics.
All futures contracts across the curve declined slightly today, suggesting a modest reduction in overall anxiety. None of these moves are dramatic, but together they paint a picture of gradual improvement in market sentiment without any sudden capitulation.
How Volatility Has Changed This Week
Let’s look at how the VIX term structure has evolved over the past five trading days:
| Contract | 04/10 (Thu) | 04/14 (Mon) | 04/16 (Wed) | 5-Day Change |
|---|---|---|---|---|
| May (30d) | 21.57 | 20.48 | 20.50 | -1.07 (-5.0%) |
| June (60d) | 21.85 | 20.90 | 21.02 | -0.83 (-3.8%) |
| July (90d) | 22.37 | 21.65 | 21.65 | -0.72 (-3.2%) |
| Aug (120d) | 22.45 | 21.90 | 21.93 | -0.52 (-2.3%) |
| Sep (150d) | 22.79 | 22.32 | 22.35 | -0.44 (-1.9%) |
VX Future Term Structure – Last 5 Days
Every single contract along the curve has declined over the past five days. The biggest moves came in the nearest-term May contract, which fell 5.0% and is now trading at 20.50. As we extend further into the future, the percentage declines moderate-September has only dipped 1.9%-but the direction is uniformly lower across all timeframes.
This broad-based improvement suggests that the market isn’t just experiencing a temporary relief rally. Rather, investors are gradually recalibrating their risk assessments across the entire year. That’s a healthy sign for equity bulls who’ve been battered since early April.
How Rare Is This VIX Level Historically?
To understand whether 17.94 is unusual, let’s examine how often we’ve seen VIX readings in this range:
| VIX Range | Occurrences (1Y) | Occurrences (YTD) | Status |
|---|---|---|---|
| 16-18 | 55 | 8 | Common |
| 17 (Today) | 33 | 7 | Moderate |
| 18-20 | 43 | 12 | Very Common |
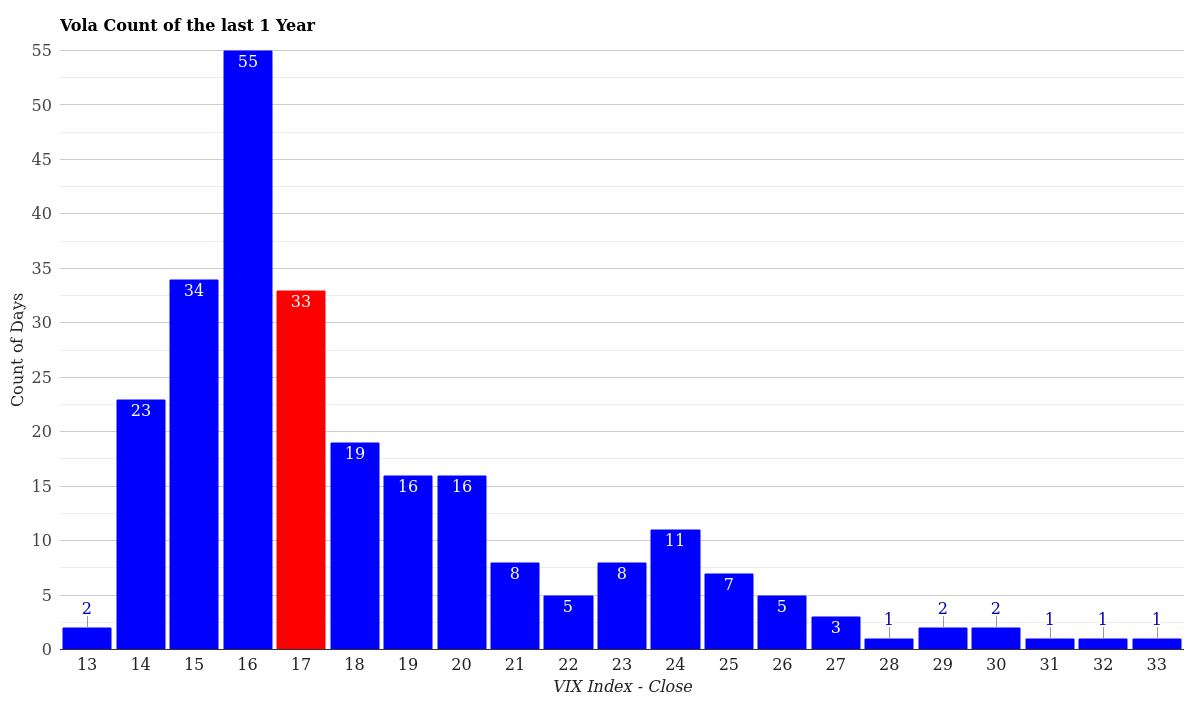
VIX Volatility Distribution – Last 12 Months
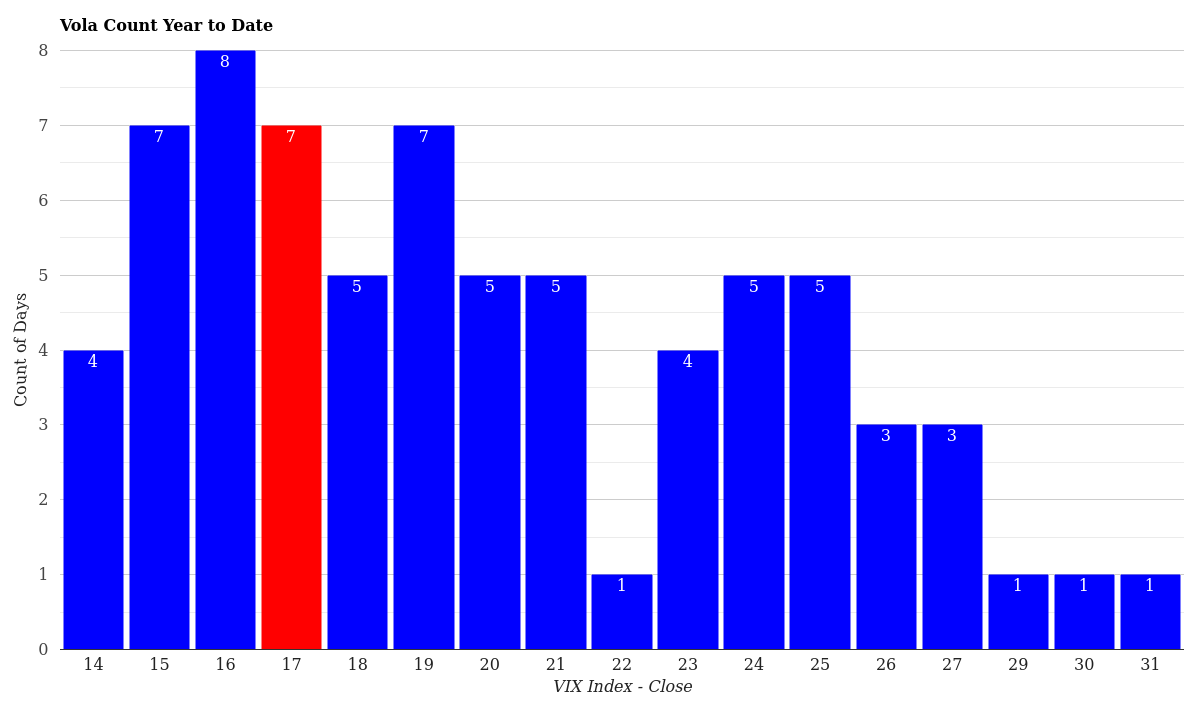
VIX Volatility Distribution – Year to Date
Over the past year, readings in the 16-18 range (where today sits) have occurred 55 times-making them quite common. In fact, this band represents some of the most frequently visited VIX territory over the past twelve months. However, year-to-date, we’ve only seen this range 8 times, which reveals how unusual it is for 2026 specifically.
That discrepancy is crucial. The 33 occurrences at exactly VIX 17 level over a year represent a “normal” market state that traders are very familiar with. But achieving that state after sustained pressure above 30 throughout April feels like a victory lap for volatility sellers and those positioned for mean reversion.
What This Means for Traders Right Now
A VIX at 17.94 with a healthy contango structure suggests several things for active traders:
Volatility sellers have room to work. With the index below the mean and futures declining across the board, short volatility strategies are in favorable territory. The spread between front-month and longer-dated contracts offers decent premium for calendar spreads and other income trades.
The recovery may be incomplete. Although volatility has fallen significantly from crisis levels, we’re still not at the ultra-calm readings (below 12-13) that characterized late 2025. Traders should remain aware that additional catalysts-earnings, rate decisions, or geopolitical events-could reignite fear quickly.
Support levels to watch: The median level of 17.24 sits just below today’s reading. Breaking below that would confirm a shift toward truly low volatility. On the upside, the 20-21 zone represents the next resistance, where the 3-month contracts are trading.
Term structure health is positive. The consistent contango pattern with no sign of inversion or backwardation suggests that near-term panic has been mostly wrung out while longer-term uncertainty remains priced appropriately. That’s market stability at work.
Conclusion & Market Outlook
VIX at 17.94 represents a meaningful pullback from the elevated levels that dominated April 2026. After weeks of turbulence, equity traders are finally catching a breather as volatility mean-reverts toward historical norms. The consistent structure across the entire term curve-declining but not collapsing-suggests this isn’t a false relief rally but rather a genuine recalibration of risk.
Looking ahead, keep watch on whether the VIX can settle below its two-year median of 17.24. That would mark true transition back to “normal” market conditions. Browse our daily VIX reports for historical volatility context and to track how this recovery develops.
For now, the technical setup favors continued gradual decline, but with enough uncertainty priced into longer-dated contracts to remind us that complacency is never warranted in equity markets.
For more market analysis visit stockbotty.com | Full Disclaimer