
VIX at 31.05: Fear Spikes as Markets Enter Extreme Volatility Zone
The VIX stands at 31.05 today, representing a dramatic surge in market fear and uncertainty. This report breaks down what this extreme reading means, how it compares historically, and what traders should watch as volatility remains elevated.
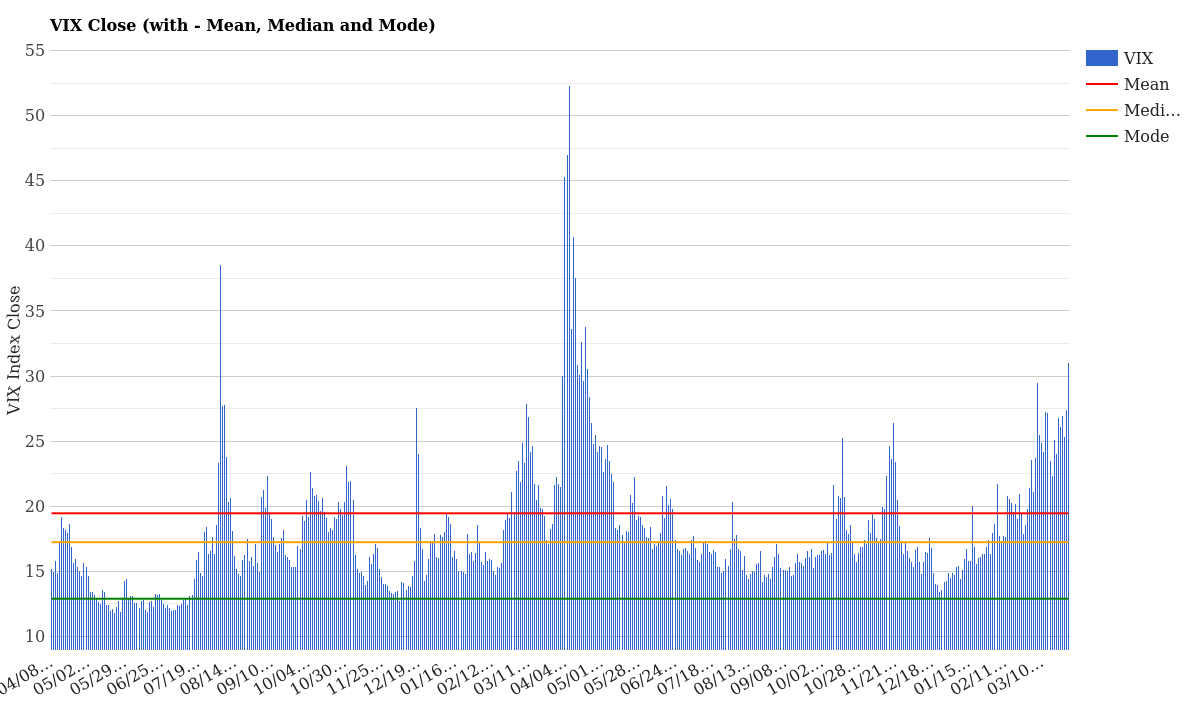
VIX Close with Mean, Median and Mode – March 30, 2026
What the Current VIX Level Means
At 31.05, we’re firmly in territory that signals genuine market stress. Yesterday’s close was 27.44, meaning volatility jumped +3.61 points (+13.16%) in a single session. Over the past five trading days, the VIX has climbed +4.90 points (+18.74%)-a meaningful acceleration that suggests fear is building rather than dissipating.
For context, consider where this ranks historically. The VIX’s two-year average sits at 19.46, and today’s reading towers +11.59 points above that baseline. We’re now in the 87.8th percentile of all trading days over the past year-meaning only about 1 in 8 days have been more volatile than today. Year-to-date, today marks the highest volatility reading of 2026, sitting at the 100th percentile.
| Volatility Metric | Value | Interpretation |
|---|---|---|
| VIX Close | 31.05 | Extreme Fear Zone |
| 1-Day Change | +3.61 (+13.16%) | Sharp single-day spike |
| 5-Day Change | +4.90 (+18.74%) | Strong uptrend in volatility |
| vs. 2-Year Mean | +11.59 | 59.6% above normal baseline |
| 1-Year Percentile | 87.8% | Ranks among most volatile days |
| YTD Percentile | 100.0% | Highest reading in 2026 |
In plain terms: markets are nervous. A reading above 25 typically signals elevated stress, and 30+ indicates extreme fear. We’re well past that threshold. For a full explanation of how the VIX works and what drives these movements, see our complete VIX guide.
VIX Term Structure: Short-Term vs Long-Term Fear
One of the most important clues about market psychology comes from comparing short-term and long-term volatility expectations. Today’s term structure reveals something critical: immediate fear is sharply elevated, but longer-dated expectations are more moderate.
| Contract | 03/27 | 03/26 | Timeframe |
|---|---|---|---|
| VIX9D | 30.64 | 27.05 | Next 9 days |
| VIX (Spot) | 31.05 | 27.44 | Current (30-day proxy) |
| VIX3M | 29.27 | 27.16 | 3-month outlook |
| VIX6M | 29.78 | 27.91 | 6-month outlook |
| VIX1Y | 28.09 | 26.76 | 1-year outlook |
Notice the curve: 30.64 → 31.05 → 29.27 → 29.78 → 28.09. We’re in what’s called a backwardation structure-short-term volatility is elevated above longer-term expectations. This pattern typically emerges when traders believe current panic will ease in coming weeks or months.
The gap between today’s spot VIX (31.05) and the one-year outlook (28.09) is +2.96 points. This suggests markets are pricing in temporary shock but expect conditions to normalize eventually. Backwardation is normal during stress events, but when it persists, it can signal either capitulation (fear peak) or genuine structural concerns.
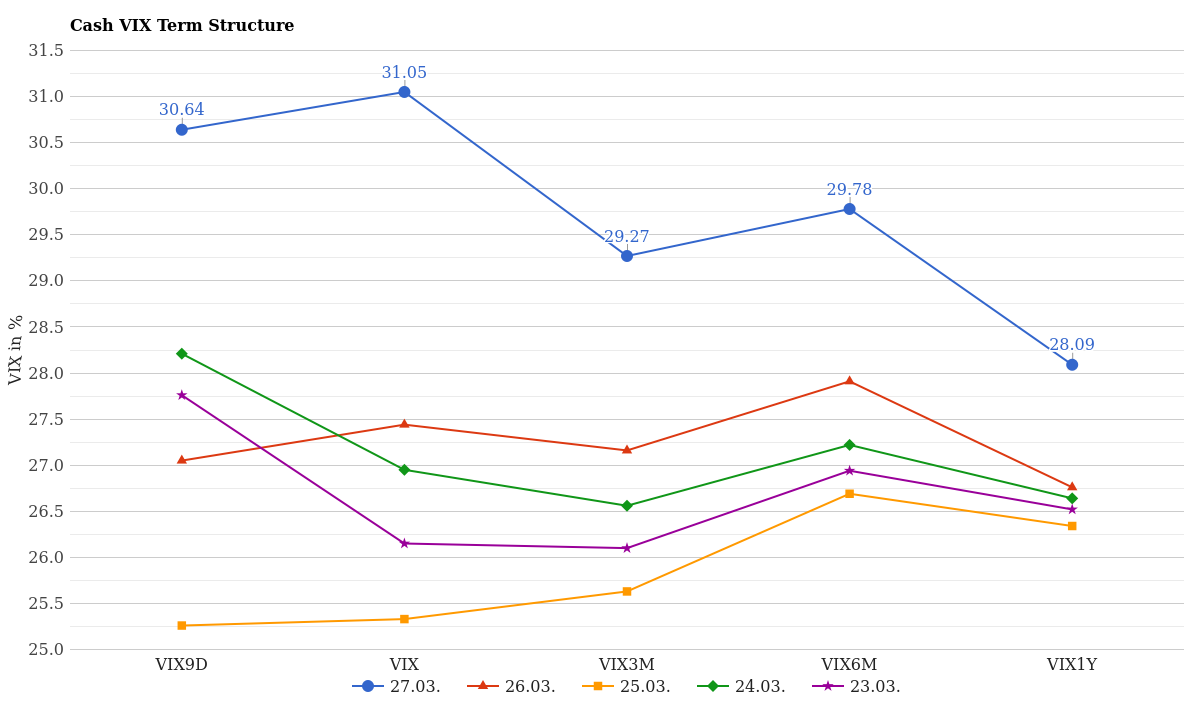
Cash VIX Term Structure (VIX9D to VIX1Y) – Last 5 Days
How Volatility Has Changed This Week
Zooming out to the five-day period reveals an accelerating uptrend in fear. Let’s examine the cash VIX index curve across April, May, and June futures contracts:
| Contract | 03/27 | 03/26 | 03/25 | 03/24 | 5-Day Change |
|---|---|---|---|---|---|
| April | 28.49 | 26.26 | 24.29 | 24.94 | +4.15 |
| May | 26.49 | 25.10 | 23.80 | 24.15 | +2.85 |
| June | 25.68 | 24.55 | 23.55 | 23.84 | +1.84 |
Every contract along the curve has moved higher. April futures are up +4.15, while even June (further out) gained +1.84. This broadbased increase across the entire term structure indicates the shock isn’t localized to immediate concerns-it’s pervasive. Markets are repricing risk expectations across multiple time horizons.
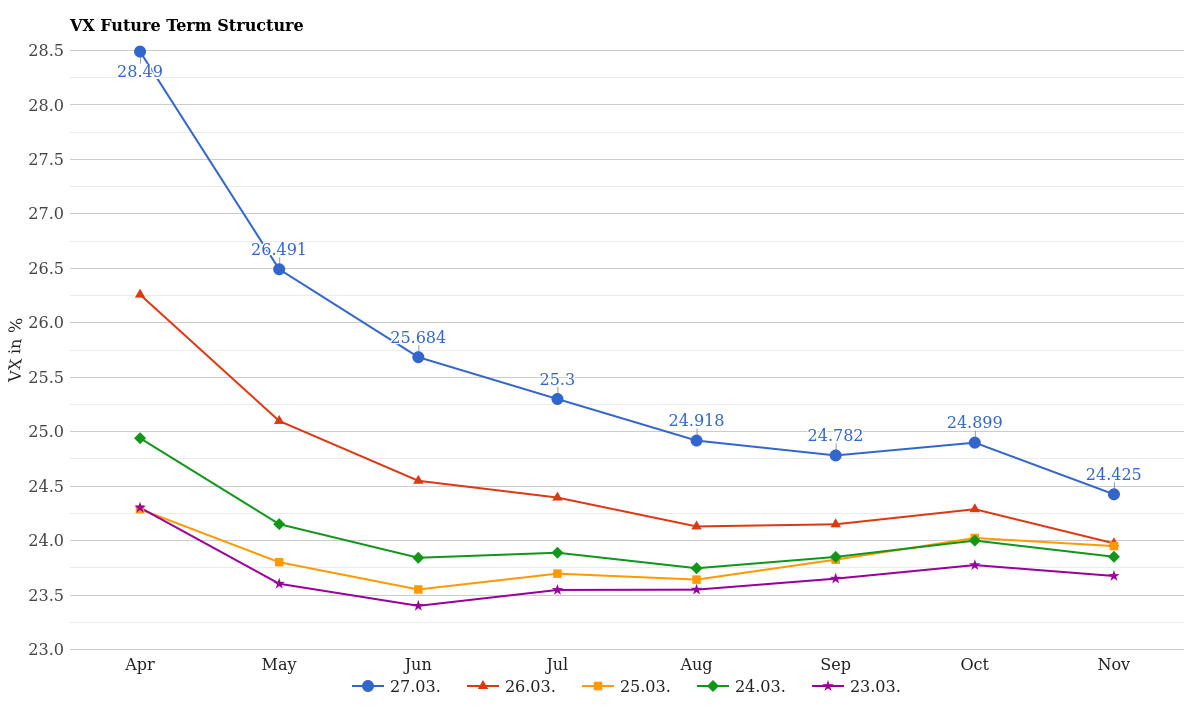
VX Future Term Structure – Last 5 Days
How Rare Is This VIX Level Historically?
At 31.05, we’re in unfamiliar territory for 2026. Let’s look at the distribution of VIX readings to understand just how extreme this is.
Over the past 12 months, the most common VIX readings cluster in the 14-17 range, with peaks at 16 (55 occurrences). Readings above 25 are rare-they occur fewer than 20 times per year. Readings above 30? Even rarer. In the 1-year dataset, only 4 days exceeded 30, and just 1 day hit 31. Today makes 2 days at or above our current level.
Year-to-date, the story is even starker. Through March 27, 2026, we’ve seen only a handful of days exceed 25. Today’s 31.05 is the highest reading of the entire year so far. The peak frequency cluster sits at 16 (8 occurrences)-a comfortable, low-volatility reading by comparison.
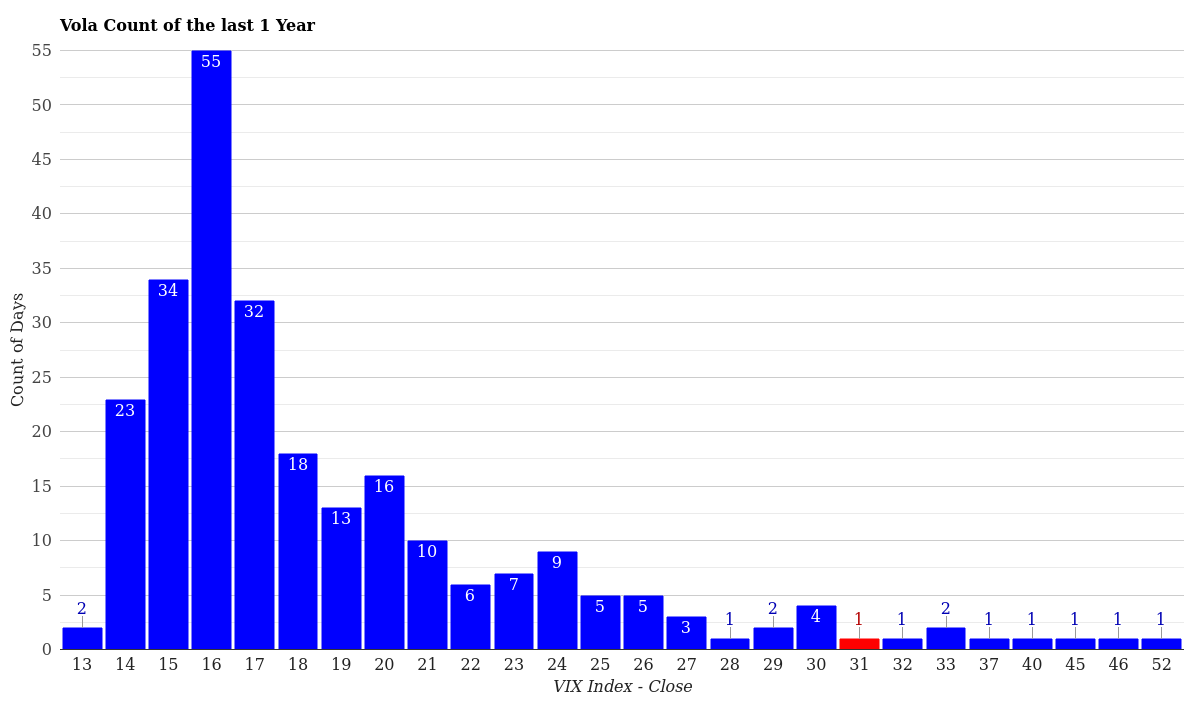
VIX Volatility Distribution – Last 12 Months
What This Means for Traders Right Now
When the VIX spikes to 31.05, three critical things deserve attention:
1. Options Premiums Are Inflated – Long volatility hedges (put spreads, collars) became dramatically more expensive yesterday. If you’ve been considering protective strategies, today’s pricing reflects acute fear. This can work both directions: selling premium into spikes often rewards patient traders, but the cost of protection has spiked.
2. Backwardation Suggests Near-Term Exhaustion – The term structure curve shows imminent volatility is highest, with longer maturities retreating. This is textbook panic behavior. History suggests markets either resolve the crisis in days (leading to sharp reversals) or sustain elevated volatility for weeks (when the curve gradually normalizes). Watch whether the VIX stays above 25 or breaks below it decisively.
3. Mean Reversion Pressures Build – At 31.05, the VIX is +13.81 points above the two-year median of 17.24. Mean reversion is not a guarantee, but extreme readings often lead to at least partial reversals. Over the next 5-10 trading days, watch for either sustained panic (rare) or a pullback toward 20-25 levels (more typical).
Key levels to monitor: 28.00 (immediate support), 25.00 (psychological barrier), and 35.00 (upside extension if panic deepens). Watch the April futures contract-if it stays above 28, expect continued elevated volatility. A break below 26 signals some relief is returning.
Conclusion & Market Outlook
The VIX at 31.05 is a flashing warning light. We’re in the extreme fear zone, with today marking the highest volatility reading of 2026. The surge of +13.16% in a single session and +18.74% over five days indicates accelerating panic, not stabilization.
However, backwardation in the term structure suggests markets believe this intense fear is temporary. Traders are pricing in near-term shock but expecting at least partial recovery in coming weeks. Watch this week closely: if volatility breaks above 35, concern deepens. If it drops below 25, relief may be underway.
For ongoing analysis and historical context, browse our daily VIX reports to track how today fits into broader market patterns. Extreme readings like this often mark inflection points-understanding where they fit historically helps traders position accordingly.
For more market analysis visit stockbotty.com | Disclaimer: stockbotty.com/disclaimer