
VIX at 25.78: Backwardation Signals Short-Term Fear Rising
The VIX currently stands at 25.78, marking a sharp +6.66% jump from yesterday’s 24.17 close. Markets are signaling elevated near-term anxiety, with the volatility term structure flashing a critical warning: fear is concentrated in the shortest timeframes. This report breaks down what today’s move means for your portfolio and which levels traders should monitor closely.
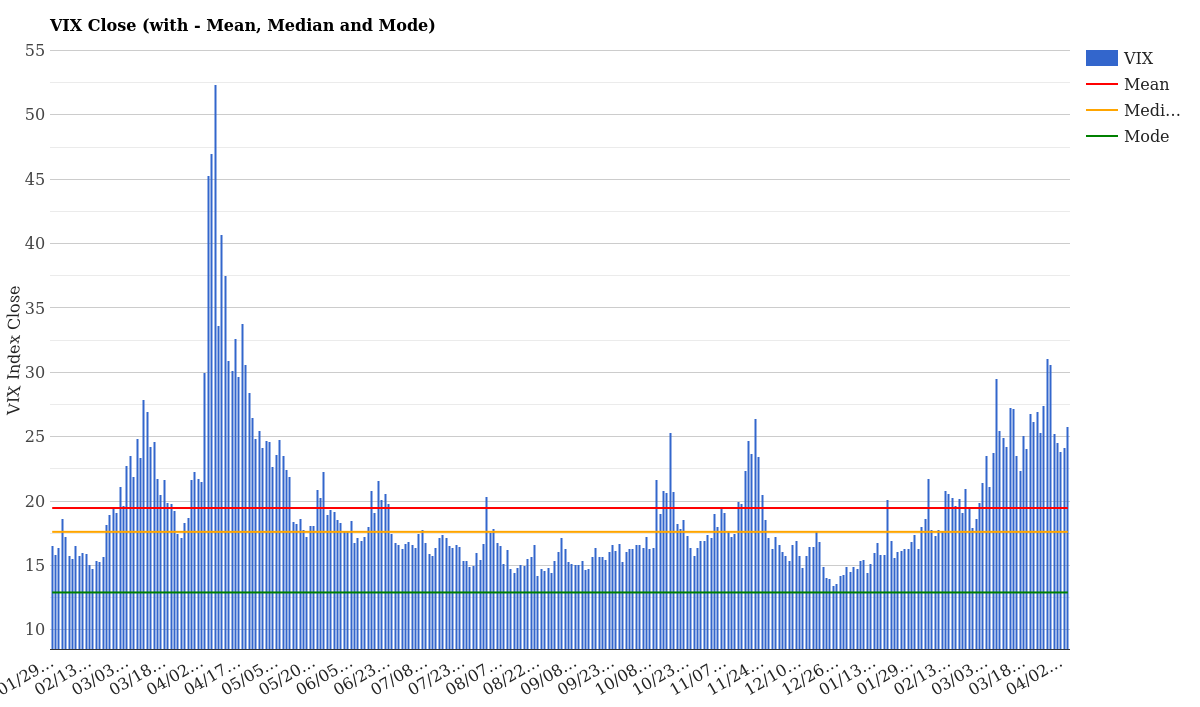
VIX Close with Mean, Median and Mode – April 08, 2026
What the Current VIX Level Means
At 25.78, we’re squarely in the high volatility zone-well above the two-year median of 17.24 and notably elevated versus the mean of 19.46. This puts today’s reading in the top 70.7% of most volatile days over the past year, and it ranks at the 100th percentile year-to-date, meaning every trading day since January 1st has been calmer than today.
| Metric | Value | Status |
|---|---|---|
| VIX Close (Today) | 25.78 | High Volatility |
| 2-Year Mean | 19.46 | +6.32 points above |
| 2-Year Median | 17.24 | +8.54 points above |
| 1-Year Percentile | 70.7% | Upper tail risk zone |
| YTD Percentile | 100.0% | Most volatile day this year |
| Daily Change | +1.61 (+6.66%) | Sharp intraday spike |
What does this tell us? Investors are genuinely worried about something happening soon. The gap between today’s reading and historical norms isn’t trivial-we’re talking about a market where uncertainty has crystallized into measurable fear.
VIX Term Structure: Short-Term vs Long-Term Fear
Here’s where the story gets really interesting. The VIX term structure today reveals a pattern called backwardation-that’s trader-speak for “the near term is scarier than the distant future.” Look at the structure:
| Timeframe | VIX Level (04/07) | Change from 04/06 | Interpretation |
|---|---|---|---|
| 9 Days (VIX9D) | 27.27 | +3.37 | Highest-immediate anxiety |
| Current (VIX) | 25.78 | +1.61 | Benchmark spot level |
| 3 Months (VIX3M) | 25.57 | +0.80 | Near-term sustained stress |
| 6 Months (VIX6M) | 26.41 | +0.59 | Peak fear further out |
| 1 Year (VIX1Y) | 25.78 | +0.16 | Outlook matches current spot |
The VIX9D at 27.27 is notably higher than the spot VIX at 25.78, confirming that traders expect the next week or so to be rougher than average. This backwardation pattern typically appears when there’s a known catalyst coming-earnings season intensity, economic data releases, Fed decisions, or geopolitical uncertainty.
Interestingly, the VIX6M peaks at 26.41, suggesting that mid-term uncertainty peaks around the six-month horizon before settling back down at the one-year mark. For a detailed explanation of how these futures contracts work, see our complete VIX guide.
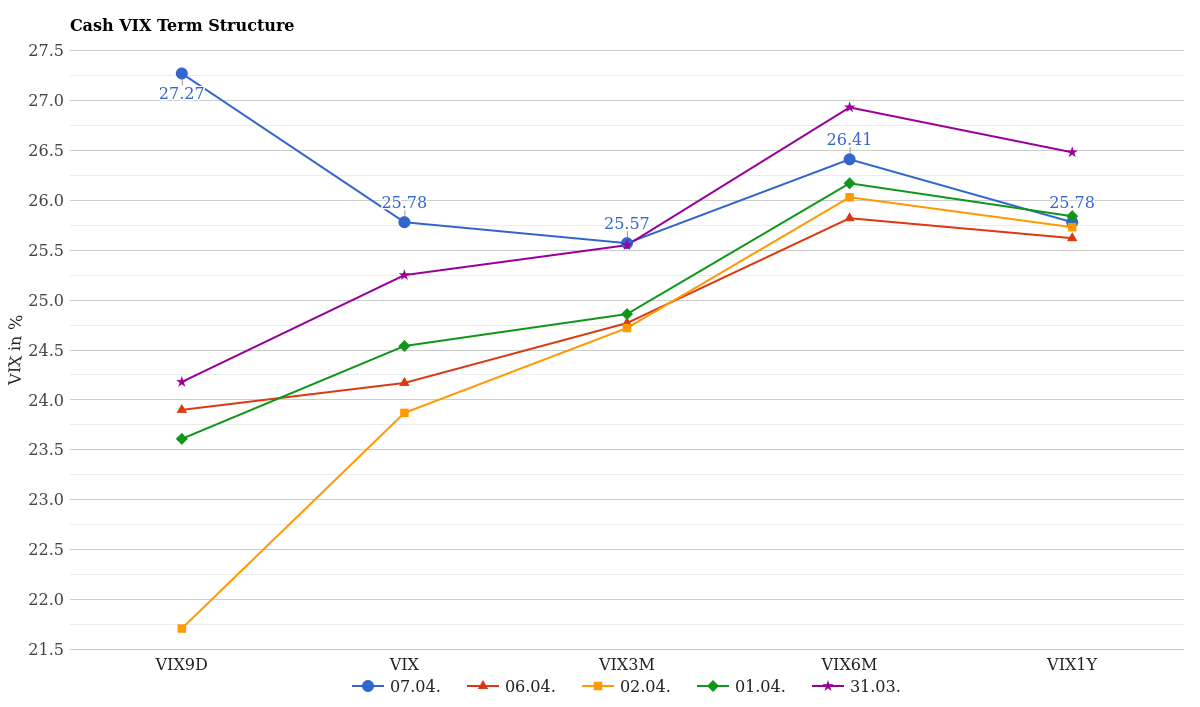
Cash VIX Term Structure (VIX9D to VIX1Y) – Last 5 Days
How Volatility Has Changed This Week
Zooming out to the weekly cash VIX curve shows where we’ve come from. April began relatively calm, but the last week has seen a steady climb in concern across all contract months:
| Contract Month | 04/07 (Today) | 04/06 | 04/02 | 5-Day Change |
|---|---|---|---|---|
| April | 24.98 | 23.84 | 24.48 | +0.50 |
| May | 24.00 | 23.31 | 23.95 | +0.05 |
| June | 23.60 | 23.28 | 23.70 | -0.10 |
| July | 23.70 | 23.53 | 23.83 | -0.13 |
| August | 23.61 | 23.54 | 23.67 | -0.06 |
| September – November | 23.59 – 23.74 | 23.60 – 23.80 | 23.63 – 23.85 | -0.04 to +0.14 |
Notice that calendar spreads are compressing slightly but remain relatively flat beyond the May contract. The market isn’t panicking about the summer or fall-it’s the next 30 days that warrant attention. This pattern is classic for tactical volatility spikes driven by near-term events rather than structural concerns about medium-term economic stability.
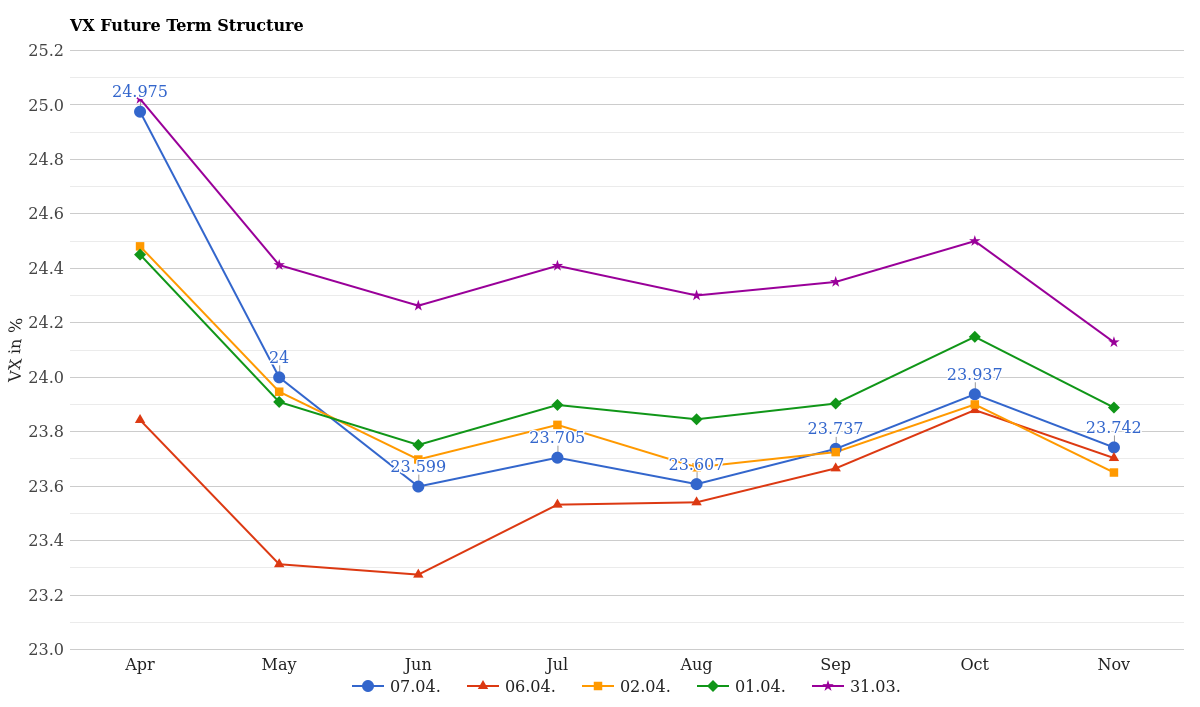
VX Future Term Structure – Last 5 Days
How Rare Is This VIX Level Historically?
To put today’s 25.78 reading in perspective, let’s examine the distribution of VIX closes over different time periods. The volacount tells us how often the VIX has closed at each specific level:
| VIX Level | 1-Year Count | YTD Count | Frequency |
|---|---|---|---|
| 13 | 2 | N/A | Very rare-peak calm |
| 14 | 23 | 4 | Low volatility baseline |
| 16 | 55 | 8 | Common range (mean-ish) |
| 20-24 | 38 | 8 | Moderate volatility zone |
| 25 | 7 | 5 | Elevated – TODAY’S ZONE |
| 30+ | 17 | 5 | Stress events (rare) |
Today’s close of 25.78 means we’re in the elevated zone. In the past year, the VIX has closed in the mid-25s range exactly 7 times. Year-to-date, it’s happened 5 times already. We’re not yet in panic territory (that typically means 30+), but we’re well beyond routine trading conditions.
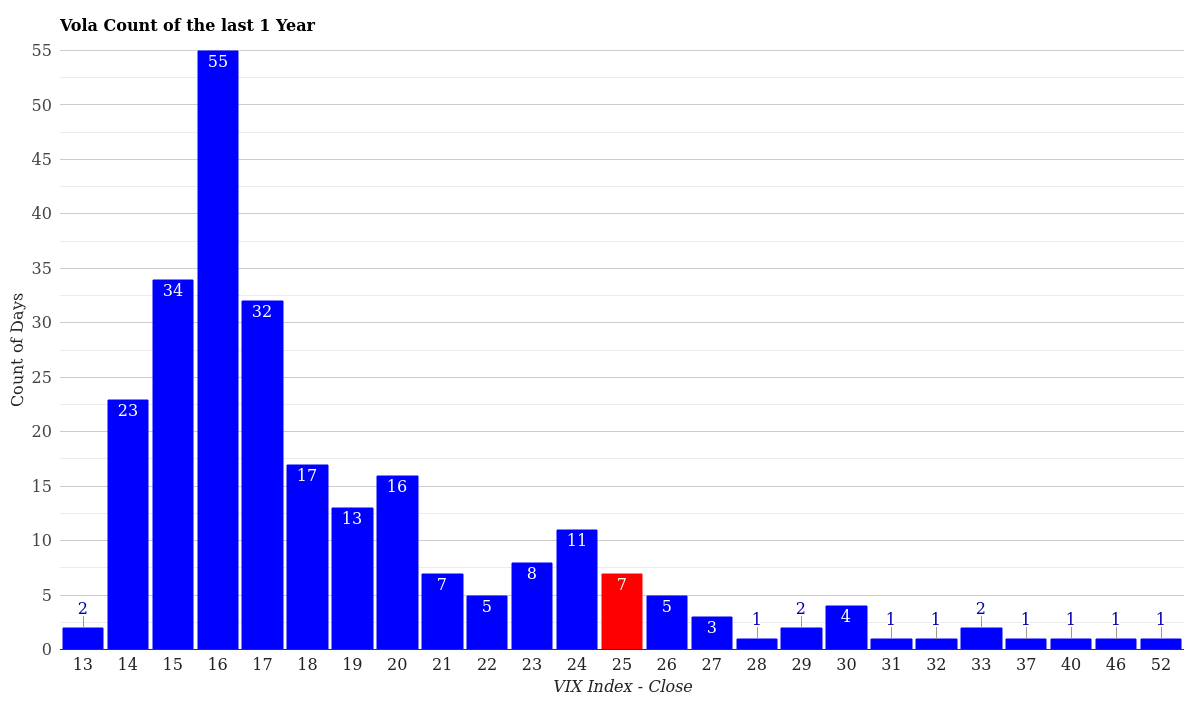
VIX Volatility Distribution – Last 12 Months
What This Means for Traders Right Now
The backwardation in today’s term structure combined with a +6.66% daily spike suggests three key things for your trading decisions.
1. Near-term hedges are expensive. If you’re buying put options or VIX call spreads to protect downside risk, you’re paying elevated premiums. The VIX9D at 27.27 reflects what option sellers are demanding. Budget accordingly, and consider whether your hedge period truly needs to be 9 days or if a longer-dated position captures your real risk window.
2. The curve structure suggests a catalyst event is expected soon. Backwardation typically appears when traders price in a known or suspected near-term event-earnings reports, economic data, earnings guidance, or policy announcements. Watch financial calendars for the next week. Whatever is driving today’s spike probably resolves or becomes clearer within days.
3. Watch the 26-30 VIX range as a pivot. We’re currently at 25.78. If the market pushes through 26, that’s another layer of stress. If we climb toward 30+, that’s a genuine panic signal. Conversely, if volatility contracts back toward 23, that’s relief. Support lies near the May contract month at 24.00.
Traders using technical analysis should note that the spike occurred on high conviction-not a wick, but a proper close well above yesterday’s level. This suggests conviction in the fear, not a false start.
Conclusion & Market Outlook
The VIX at 25.78 tells a story of compressed, near-term anxiety in the markets. The backwardation pattern-with the 9-day measure well above spot and the 6-month contract near its peak-indicates that traders expect the next week or two to remain bumpy, then perhaps stabilize further out.
This is not a market crash condition yet, but it’s a yellow flag worth respecting. Position accordingly, avoid over-leveraging into uncertainty, and use any rallies to rebalance. For additional historical context on volatility patterns like today’s, browse our daily VIX reports to see how similar patterns have played out.
Monitor the VIX closely over the next five trading days. If today’s spike was a one-day event, fear should contract back toward 23. If it persists or spreads into longer-dated contracts, that’s a signal to tighten risk management.
Disclaimer: This article is for informational purposes only and does not constitute financial or investment advice. All data presented is historical and statistical in nature. Past performance and volatility patterns are not indicative of future results. Before making any trading or investment decisions, consult with a qualified financial advisor. The VIX is a complex instrument; understand the risks before trading it or related derivatives.
Author Disclosure: The author may hold or has held positions in VIX-related instruments directly or through derivative constructs at the time of publication. This article is not a trading recommendation. Always conduct your own due diligence and risk assessment before trading volatility products.
For more market analysis visit stockbotty.com | Full Disclaimer