
VIX at 25.33: Markets Step Back From Peak Stress
The VIX currently sits at 25.33, down 1.62 points (6.01%) from yesterday’s close of 26.95. While still elevated and signaling meaningful market anxiety, today’s pullback suggests fear is cooling after a volatile stretch. This report breaks down what current volatility levels mean for traders, how the market structure reveals differing short-term and long-term concerns, and what historical context tells us about where we stand.
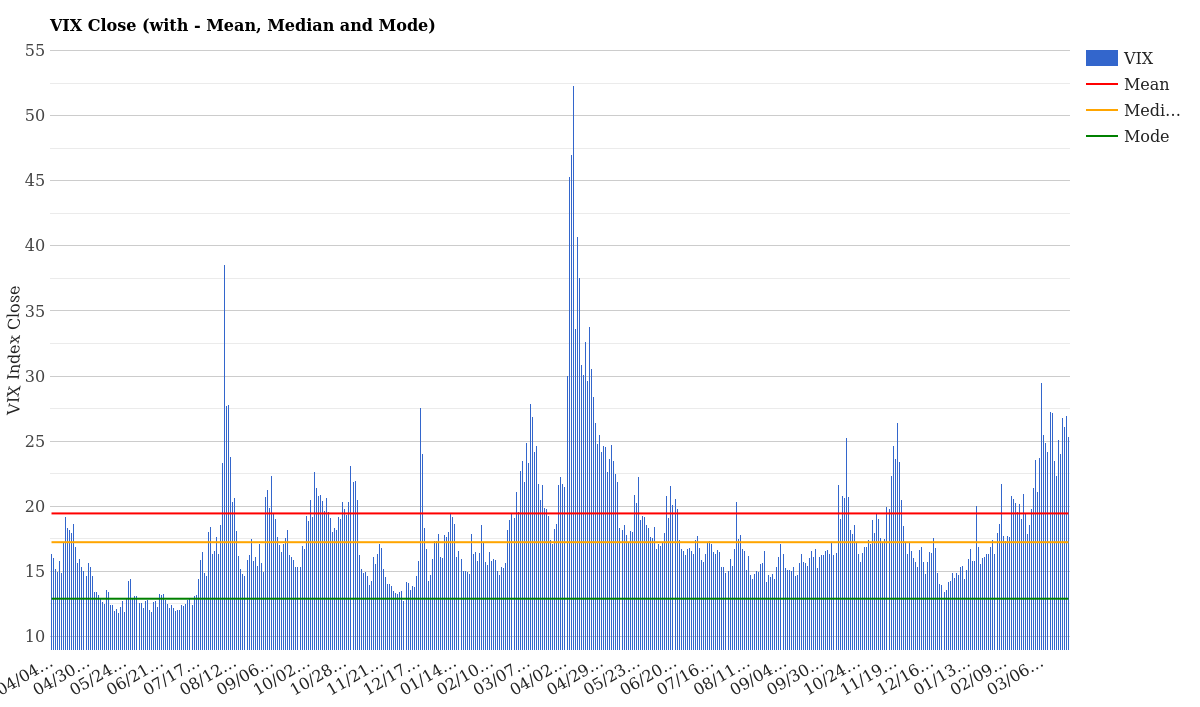
VIX Close with Mean, Median and Mode – March 26, 2026
What the Current VIX Level Means
At 25.33, volatility remains firmly in the “high” zone-well above the historical median of 17.24 and significantly above the 2-year mean of 19.45. In practical terms, the market is pricing in greater price swings and uncertainty than what we typically see. This isn’t panic territory (that would be 30+), but it reflects genuine risk aversion among traders.
Today’s decline of 6% tells an important story: after surging into late March with elevated readings, some of that acute fear has begun to dissipate. The VIX sits +5.88 points above the 2-year mean and +8.09 above the median, confirming we’re still in stressed conditions-just not the most extreme ones of recent weeks.
| Metric | Value | Status |
|---|---|---|
| VIX Close (Today) | 25.33 | High Volatility |
| Daily Change | -1.62 (-6.01%) | Moderating |
| 2-Year Mean | 19.45 | Above Normal |
| vs Mean Differential | +5.88 | Elevated Stress |
| 2-Year Median | 17.24 | Reference Level |
| vs Median Differential | +8.09 | Stress Zone |
| 1-Year Percentile | 69.4% | Above Most Days |
| YTD Percentile | 100.0% | Peak 2026 Volatility |
The YTD percentile of 100% is particularly noteworthy-this is the highest volatility reading we’ve seen since January 1, 2026. For a deeper understanding of how the VIX is calculated and what different levels mean, check our complete VIX guide.
VIX Term Structure: Short-Term vs Long-Term Fear
The term structure reveals how fear is distributed across different time horizons. When traders worry about near-term shocks, the short-term VIX (like VIX9D) spiked relative to longer-dated contracts. Today, we see a textbook contango structure-meaning longer-dated contracts are priced slightly higher than near-term ones, a sign the market expects volatility to persist but not worsen dramatically.
| Contract | Today (03/25) | Yesterday (03/24) | 5-Day Change |
|---|---|---|---|
| VIX9D (9-Day) | 25.26 | 28.21 | -3.63% |
| VIX (Current) | 25.33 | 26.95 | -6.01% |
| VIX3M (3-Month) | 25.63 | 26.56 | -3.51% |
| VIX6M (6-Month) | 26.69 | 27.22 | -1.95% |
| VIX1Y (1-Year) | 26.34 | 26.64 | -1.13% |
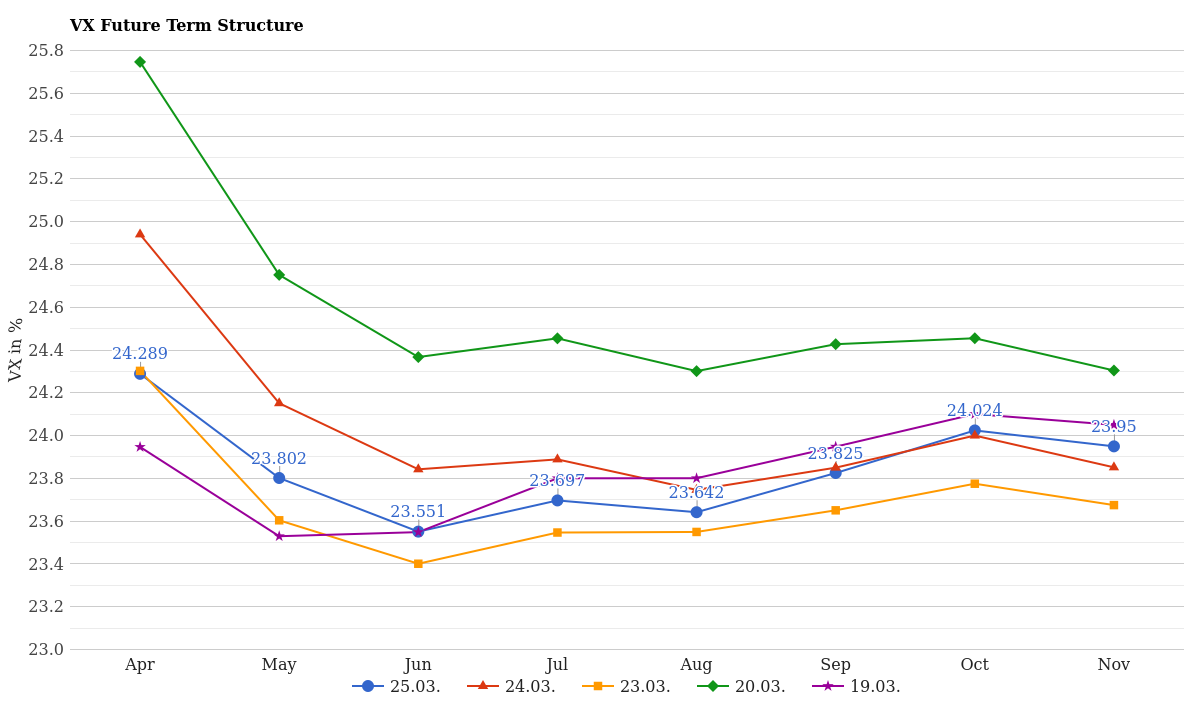
VX Future Term Structure – Last 5 Days
Notice the slope: VIX9D (25.26) sits slightly below the spot VIX (25.33), then the curve gradually rises to 26.34 at the 1-year mark. This contango arrangement suggests traders see near-term relief possible but expect baseline volatility to remain elevated through the next several months. The decline across all tenors compared to yesterday reinforces the narrative of stress slowly bleeding out.
How Volatility Has Changed This Week
Over the past five trading days, the spot VIX has moved +1.27 points, a +5.28% climb from March 20. The week started relatively calm (19.80 on March 20) before market anxiety accelerated. Let’s see how the cash VIX curve evolved:
| Expiry | 03/20 | 03/23 | 03/24 | 03/25 | 5-Day Move |
|---|---|---|---|---|---|
| April | 25.75 | 24.30 | 24.94 | 24.29 | -1.46 |
| May | 24.75 | 23.60 | 24.15 | 23.80 | -0.95 |
| June | 24.37 | 23.40 | 23.84 | 23.55 | -0.82 |
| July – Nov | 23.6-24.5 | 23.5-23.9 | 23.8-24.1 | 23.6-24.0 | Mild |
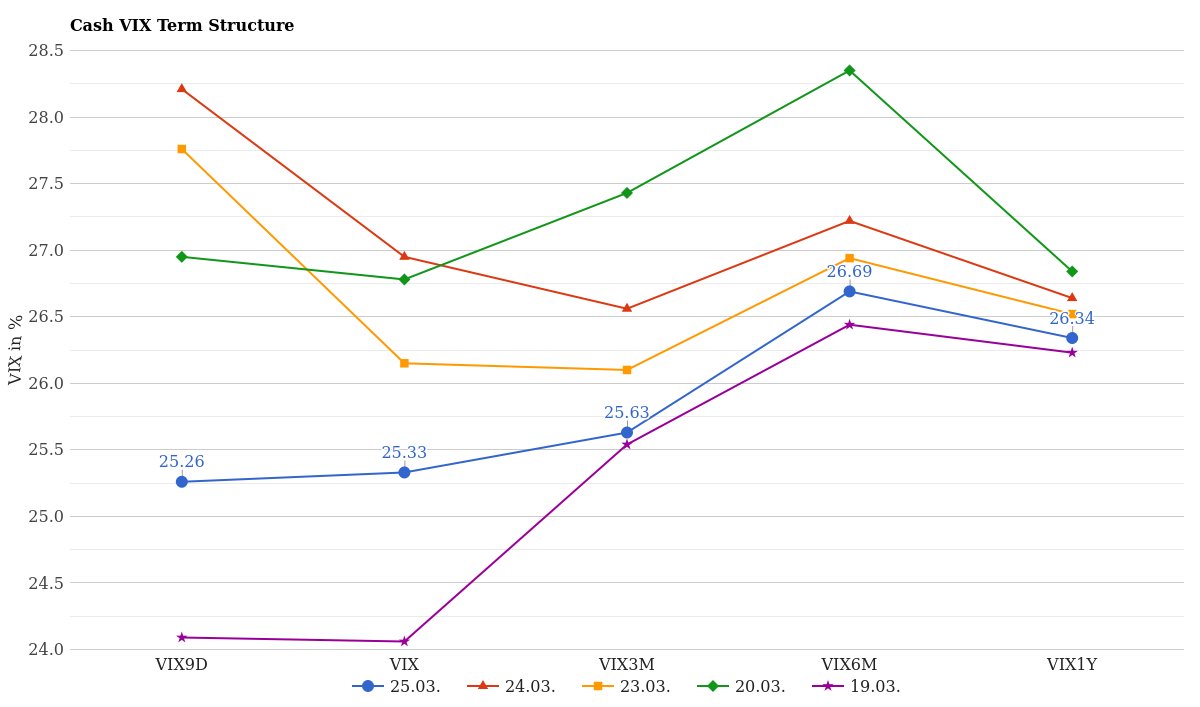
Cash VIX Term Structure (VIX9D to VIX1Y) – Last 5 Days
All contract months have retreated from March 24’s peaks, with the April contract down the most (1.46 points). Longer-dated months show stability, indicating the market has largely priced in the near-term stress and expects a return to more moderate volatility later in spring.
How Rare Is This VIX Level Historically?
Reading 25.33 sits at the 69.4th percentile over the past year-meaning only about 30% of trading days since March 2025 have shown higher volatility. Year-to-date, this marks the absolute peak reading since January 1, 2026. But is this extreme in the broader context?
Looking at the 1-year volacount distribution, VIX levels in the 25-26 range occur roughly 5 days per year on average. The cluster of elevated readings in early April 2025 (with spikes to 45+) were exceptional events. Today’s level, while stressed, is far more common than those April extremes.
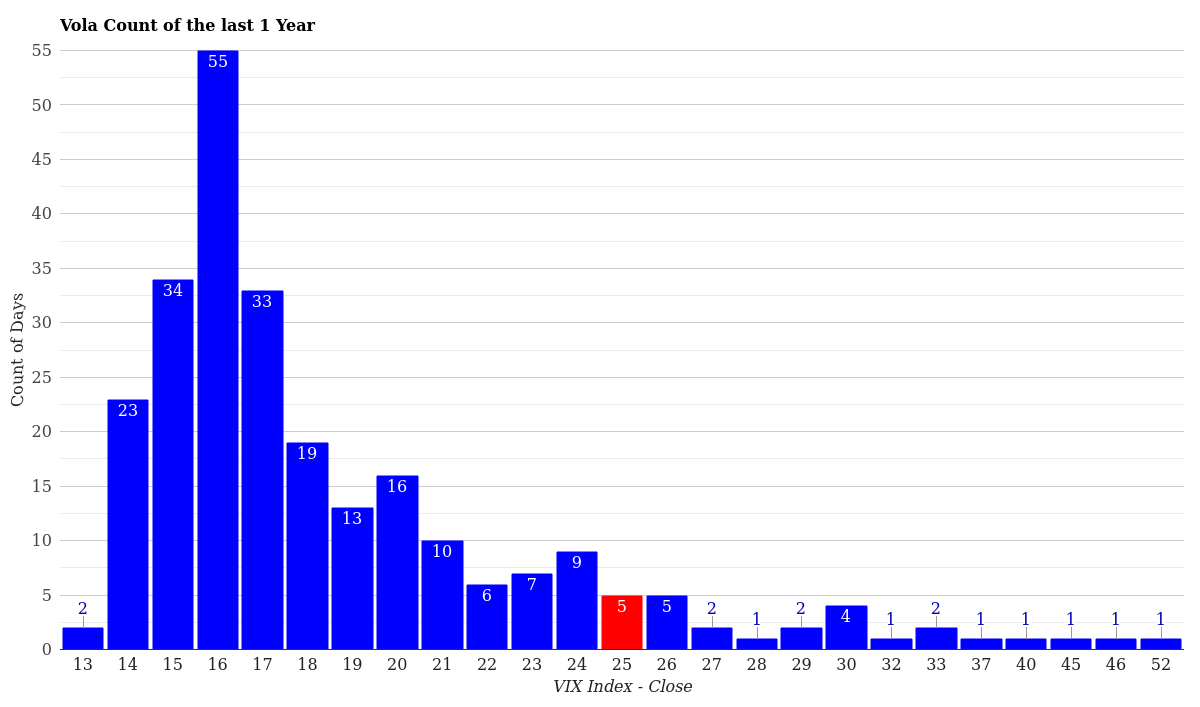
VIX Volatility Distribution – Last 12 Months
Year-to-date through March 26, 2026, the highest concentration of trading days cluster between 14-16 on the VIX scale. The readings above 25 have emerged only in the past few weeks, signaling this is indeed a heightened period but not unprecedented within recent market history.
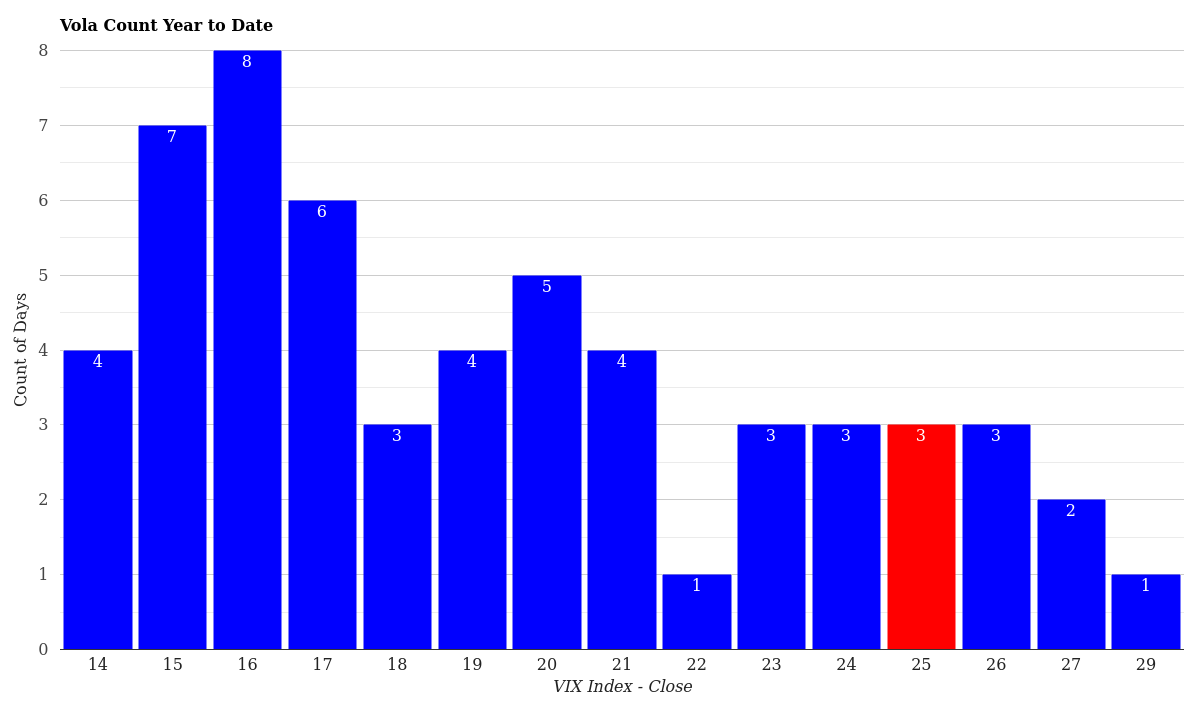
VIX Volatility Distribution – Year to Date
What This Means for Traders Right Now
Today’s pullback in VIX from 26.95 to 25.33 is meaningful but shouldn’t be mistaken for a full reset. Markets remain in a state of caution. The contango structure tells us traders expect volatility to persist, not evaporate. This environment favors strategies that can adapt to continued uncertainty-neither aggressively bullish nor deeply bearish positioning works well when fear remains elevated but stabilizing.
For portfolio managers, the +5.88 point premium to the 2-year mean suggests hedging costs remain elevated. Put options, volatility ETFs, and defensive positioning all trade at a premium. If the current stress phase continues to moderate over coming sessions, mean reversion could accelerate downward-rewarding those who trim hedges gradually rather than all at once.
Key levels to monitor: A close above 26.5 would signal the stress phase is not yet broken. A sustained move below 23.5 (closer to the mean) would suggest genuine fear is draining from the market. Until one of those scenarios clarifies, expect the 23-27 trading range to dominate.
Conclusion & Market Outlook
At 25.33, the VIX reflects a market that remains nervous but no longer panicking. The 6% daily decline is a welcome sign that acute anxiety peaked earlier in the week. The contango term structure reinforces that this is a normalization phase-volatility is expected to persist but not worsen materially.
Historically, when the VIX sits in this zone, the most likely path is a slow walk down toward 20 rather than a sudden crash below 15. Traders should prepare for continued elevated uncertainty through at least the next earnings season while remaining alert for any fresh catalysts that could reignite fear.
For historical context and analysis of previous volatility regimes, browse our daily VIX reports and volatility analysis archive.
For more market analysis visit stockbotty.com | Full Disclaimer