
VIX at 25.25: Markets Exhale After Major Volatility Spike
Yesterday’s panic is fading fast. The VIX closed at 25.25 on March 31st, down sharply from 30.61 the day before-a 17.51% single-day collapse that signals meaningful relief across equity markets. This report breaks down what that recovery means, whether it’s sustainable, and what traders should watch next.
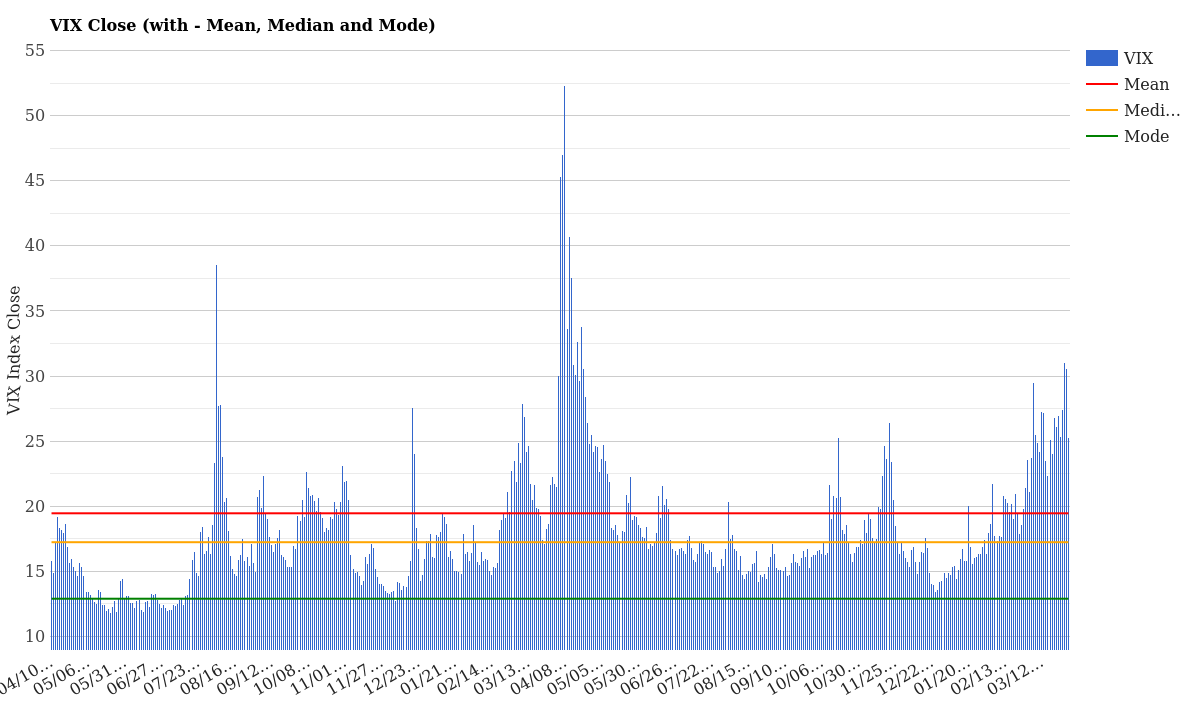
VIX Close with Mean, Median and Mode – April 01, 2026
What the Current VIX Level Means
A VIX of 25.25 sits well above normal market conditions but represents genuine de-escalation from yesterday’s stress levels. To put this in perspective: the two-year mean sits at 19.46, the median at 17.24, and the historical mode at 12.90. Today’s reading still lands 5.79 points above average and 8.01 points above median-meaningful elevation, but not panic territory anymore.
On a historical percentile basis, today’s VIX places this volatility event in the 69.4th percentile for the last year and in the 100th percentile year-to-date. Translation: this has been an unusually turbulent quarter, but we’re not at the extremes we saw just 24 hours ago.
| Metric | Value | Interpretation |
|---|---|---|
| VIX Today | 25.25 | Elevated, recovery phase |
| 2-Year Mean | 19.46 | +5.79 above normal |
| 2-Year Median | 17.24 | +8.01 above typical |
| Daily Change | -5.36 (-17.51%) | Sharp one-day relief |
| YTD Percentile | 100% | Highest this year so far |
In plain English: markets were terrified yesterday. Today they’re nervous but recovering. Whether that recovery holds depends heavily on what happens next in the equity markets and whether fresh risk events emerge.
VIX Term Structure: Short-Term vs Long-Term Fear
One of the most useful signals hidden in VIX data is the term structure-essentially a map showing whether fear is concentrated in the near term or spread across months. Today’s structure tells an important story about market confidence.
| Contract | Level | Time Horizon |
|---|---|---|
| VIX9D | 24.18 | Next 9 days |
| VIX Spot (Today) | 25.25 | Immediate (30-day) |
| VIX3M | 25.55 | 3 months out |
| VIX6M | 26.93 | 6 months out |
| VIX1Y | 26.48 | 1 year out |
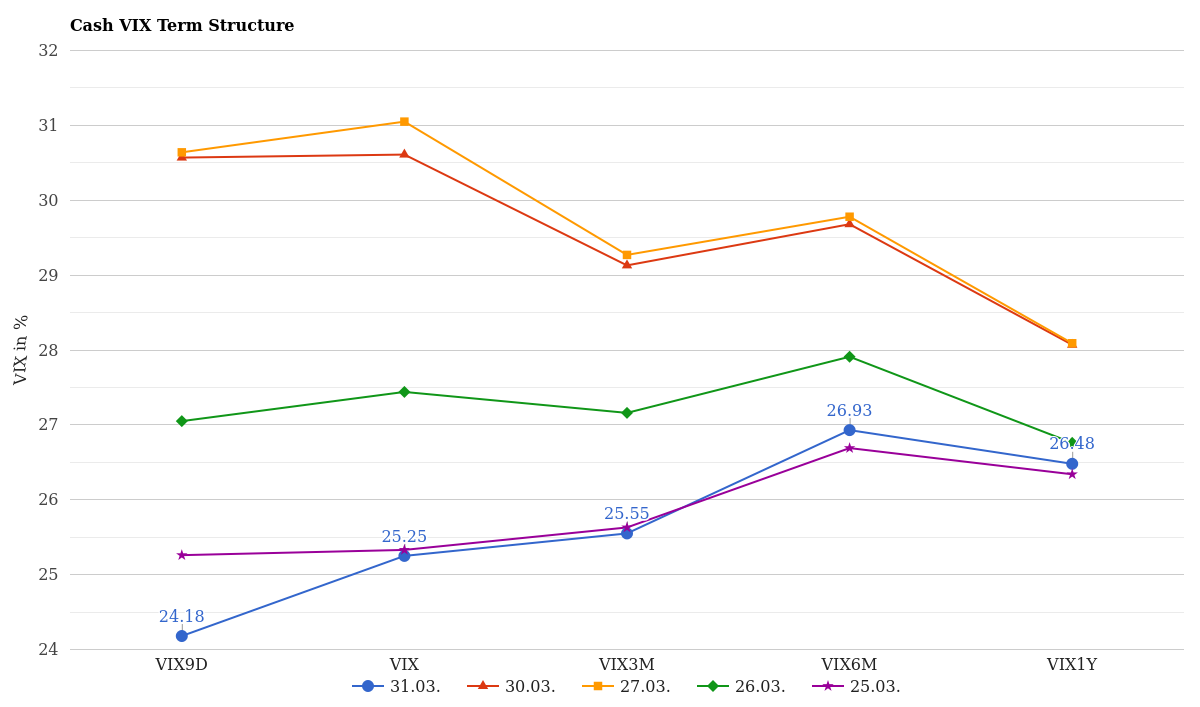
Cash VIX Term Structure (VIX9D to VIX1Y) – Last 5 Days
This is textbook contango-the normal market condition where fear increases as you look further into the future. The structure climbs from 24.18 (9-day) to 26.48 (1-year), suggesting that while immediate panic is cooling, market participants still expect volatility to remain elevated for months ahead.
What does that mean? Institutional traders and options strategists aren’t convinced the turmoil is over. They’re pricing in persistent uncertainty, even as today’s equity rally provided temporary relief. For a full explanation of how these contracts work, see our complete VIX guide.
How Volatility Has Changed This Week
Zooming out slightly reveals just how wild the last few trading days have been. Compare the VIX closes across the week:
| Date | VIX Close | Day Change |
|---|---|---|
| March 25 | 24.29 | – |
| March 26 | 26.26 | +7.97% |
| March 27 | 28.49 | +8.47% |
| March 30 | 30.61 | +7.45% |
| March 31 | 25.25 | -17.51% |
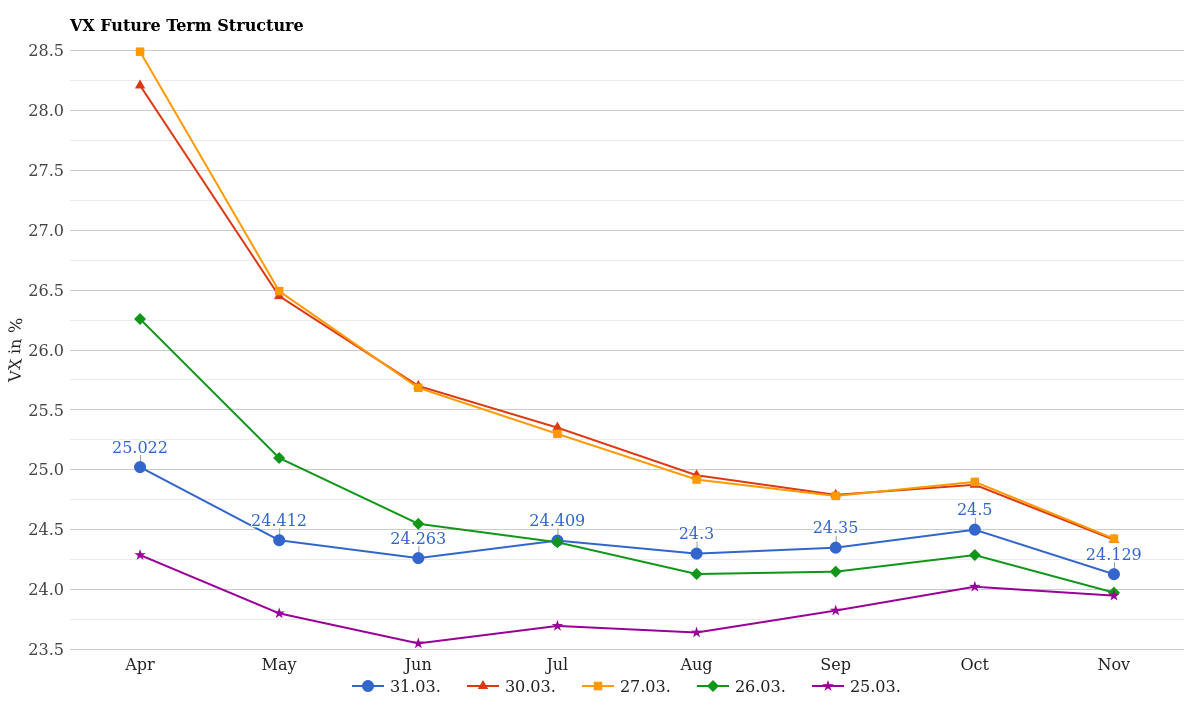
VX Future Term Structure – Last 5 Days
This pattern-slow burn up, then sharp reversal-is typical when a shock event (geopolitical, earnings-related, or macro) triggers capitulation. Tuesday-Thursday saw cumulative gains of 25.95% as fear spread. Friday’s 17.51% drop suggests panic sellers hit the eject button and buyers stepped in to catch the falling knife.
The five-day net change is nearly flat: down just 0.08 points (-0.32%) from March 25 to March 31. That stability at the week level masks violent intraday and daily swings-classic hallmark of a market processing a shock.
How Rare Is This VIX Level Historically?
Numbers like 25 or 30 don’t tell the full story without context. Here’s where we stand in the distribution of volatility across the past 12 months and year-to-date:
| VIX Level | Days (1Y) | Days (YTD) | Frequency |
|---|---|---|---|
| 13-14 | 25 | 4 | Very common (calm market) |
| 15-17 | 89 | 15 | Normal (baseline) |
| 18-20 | 55 | 6 | Elevated (watching) |
| 21-25 | 32 | 4 | High stress zone |
| 26-30 | 8 | 3 | Extreme stress (rare) |
| 31+ | 4 | 1 | Panic zone (crisis) |
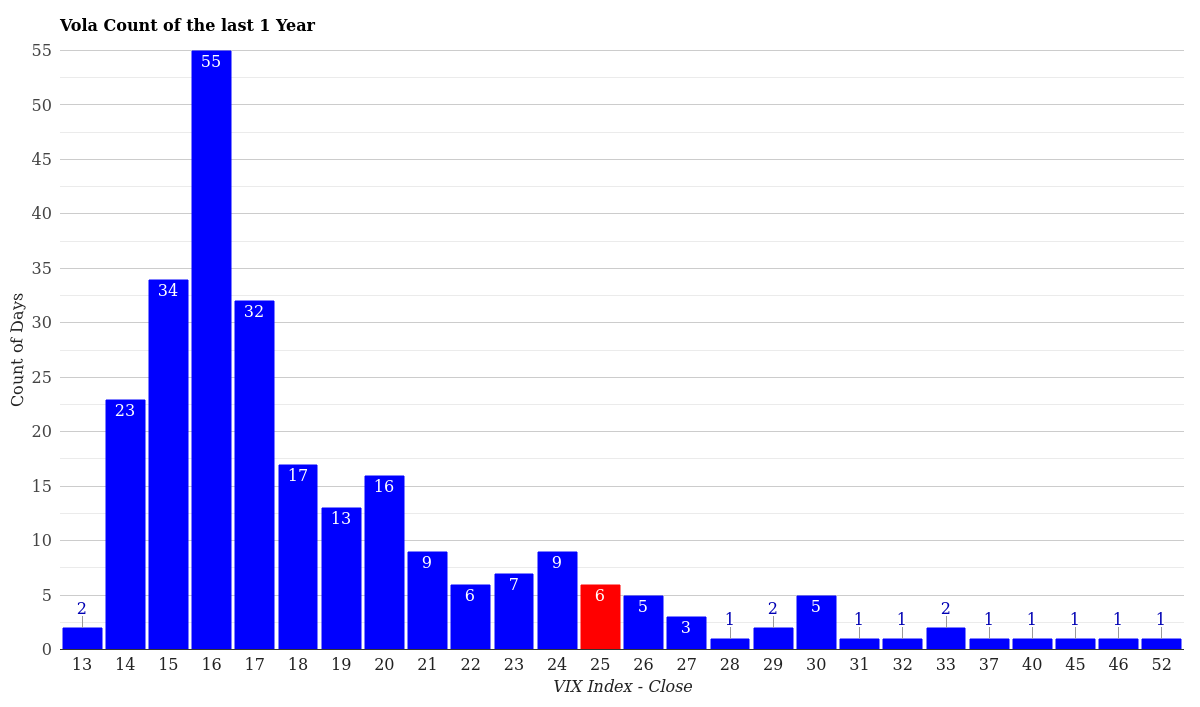
VIX Volatility Distribution – Last 12 Months
Today’s 25.25 sits squarely in the “high stress zone”-levels seen only 32 times in the past year. Year-to-date, we’ve had 4 trading days in the 21-25 range, reflecting the unusually turbulent start to 2026. Nothing has breached 31+ today, but we had a brush with panic-zone territory on Friday morning before the reversal.
Most alarming: in a normal year, VIX spends the vast majority of time between 13-17. The concentration of high volatility days in Q1 2026 is genuinely unusual and warrants caution.
What This Means for Traders Right Now
Today’s drop is encouraging, but three key risks remain on the radar:
1. Sustainability Question. A 17.51% single-day VIX collapse often marks a capitulation low, but it doesn’t guarantee a sustained recovery. Monitor Monday’s opening closely-if equity futures turn negative, VIX could re-spike. The 26-27 resistance level is critical.
2. Contango Is Your Friend (For Now). The term structure sloping upward means front-month volatility is cheaper than deferred contracts. Options traders can use this to construct bullish strategies with defined risk. However, if stress re-emerges, the whole curve will shift up faster than it came down.
3. Watch the 24-26 Range. If the VIX settles into 24-26 over the next 5 trading days, it suggests underlying volatility is finding equilibrium after shock absorption. Break above 28 signals a fresh leg of selling; break below 22 signals genuine recovery. Anything in between is just noise.
For short-term traders: put spreads look reasonable at current levels. For long-term investors: elevated VIX is actually a gift-it makes hedges cheaper. Don’t panic-sell on down days when fear is priced in; instead, rebalance and buy selectively.
Conclusion & Market Outlook
The VIX at 25.25 tells us that markets remain nervous but are no longer in free-fall. Yesterday’s 30.61 spike was a flushing event; today’s recovery is the natural elastic snap-back. Whether calm persists depends entirely on what news flow and macro data look like in the coming days.
Key levels to monitor: 24 (support-loss of this breaks the recovery narrative), 27 (resistance-renewed stress), and 19.5 (mean reversion target if calm truly takes hold).
For ongoing analysis and context, browse our daily VIX reports to track how volatility evolves in real time. Each day provides fresh clues about market psychology and risk appetite.
For more market analysis visit stockbotty.com | Disclaimer: stockbotty.com/disclaimer