
VIX at 24.54: Volatility Cooling After March’s Turbulent Peak
The VIX currently stands at 24.54, marking a decisive pullback from the elevated volatility that dominated late March. After touching 31.05 just five days ago, the fear index has retreated nearly 11%, signaling that markets are gradually regaining composure. This report breaks down what that cooling trend means for your trading decisions, where short-term and long-term volatility diverge, and whether this calm will hold.
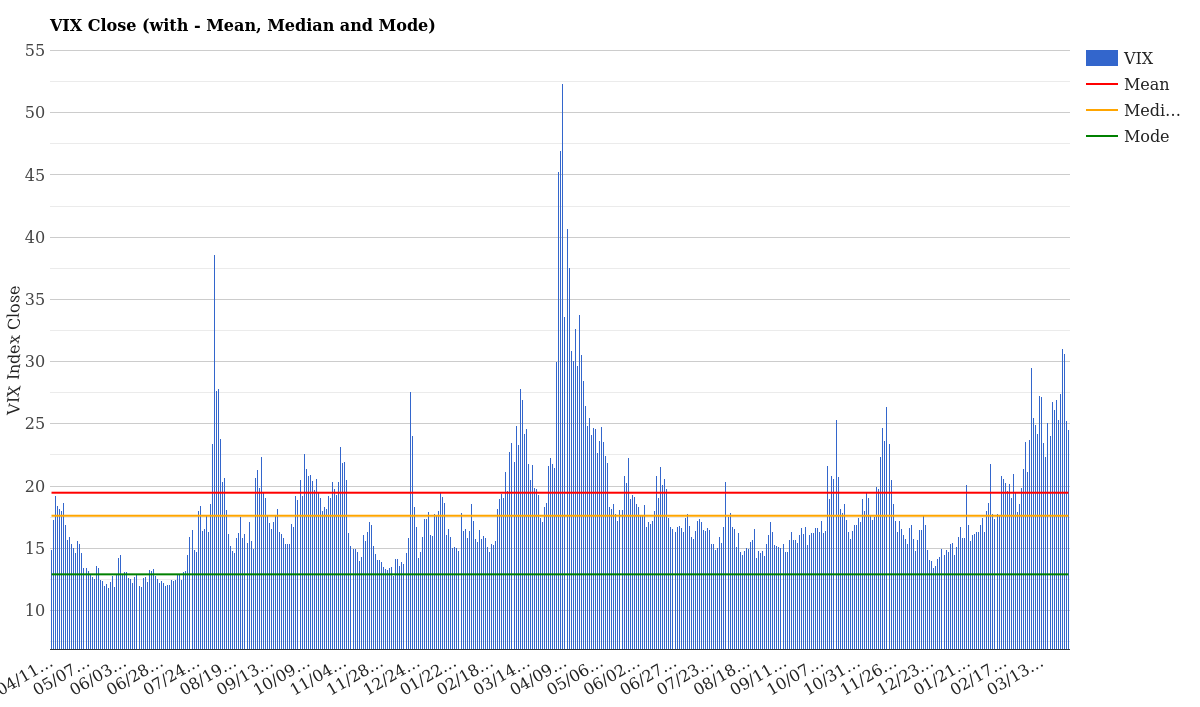
VIX Close with Mean, Median and Mode – April 02, 2026
What the Current VIX Level Means
At 24.54, the VIX sits firmly in elevated territory, sitting 5.08 points above the two-year average of 19.46. For context, this places today’s reading at the 64th percentile over the past year-meaning roughly two-thirds of trading days have seen lower volatility. Compared to the historical median of 17.24, we’re 7.30 points higher, confirming that fear remains present, just not acute.
Yesterday’s reading of 25.25 shows the VIX declining by 0.71 points (-2.81%) in a single session. That’s meaningful movement but not dramatic-more consistent with normal daily fluctuation than panic relief. The five-day trend, however, tells a starkly different story: the index has shed 2.90 points (-10.57%) since March 27, when it hit 27.45.
| Metric | Value | Interpretation |
|---|---|---|
| VIX Today | 24.54 | Above mean, elevated but contained |
| 1-Day Change | -0.71 (-2.81%) | Modest improvement, normal volatility decay |
| 5-Day Change | -2.90 (-10.57%) | Significant relief from peak, trend reversing |
| vs 2-Year Mean | +5.08 | Still above normal baseline expectations |
| 1-Year Percentile | 64th | High but not extreme; plenty of historical precedent |
Bottom line: We’re in a “wait and see” phase. Markets haven’t returned to complacency, but they’ve stopped actively panicking. For a detailed explanation of what the VIX actually measures and how it’s calculated, check out our complete VIX guide.
VIX Term Structure: Short-Term vs Long-Term Fear
One of the most powerful tools for understanding market psychology is the VIX term structure-the curve that shows how fear evolves across different time horizons. Today’s structure reveals something crucial: short-term anxiety is significantly elevated compared to long-term expectations.
| Contract | Today | Yesterday | Change |
|---|---|---|---|
| VIX9D (9-day) | 23.61 | 24.18 | -0.57 |
| VIX (1-month) | 24.54 | 25.25 | -0.71 |
| VIX3M (3-month) | 24.86 | 25.55 | -0.69 |
| VIX6M (6-month) | 26.17 | 26.93 | -0.76 |
| VIX1Y (1-year) | 25.84 | 26.48 | -0.64 |
Reading this curve from left to right-9-day out to 1-year-reveals a pattern called contango: longer-dated fear expectations exceed short-term readings. The structure flows upward from 23.61 (9-day) to 26.17 (6-month), then softens slightly at the 1-year mark.
What does this mean? The market is pricing in near-term volatility relief but maintaining elevated caution for the next 3-6 months. Traders expect conditions to improve over the next week or two but aren’t confident enough to bet on sustained calm through summer. This is the behavior of a market acknowledging a problem without yet declaring it solved.
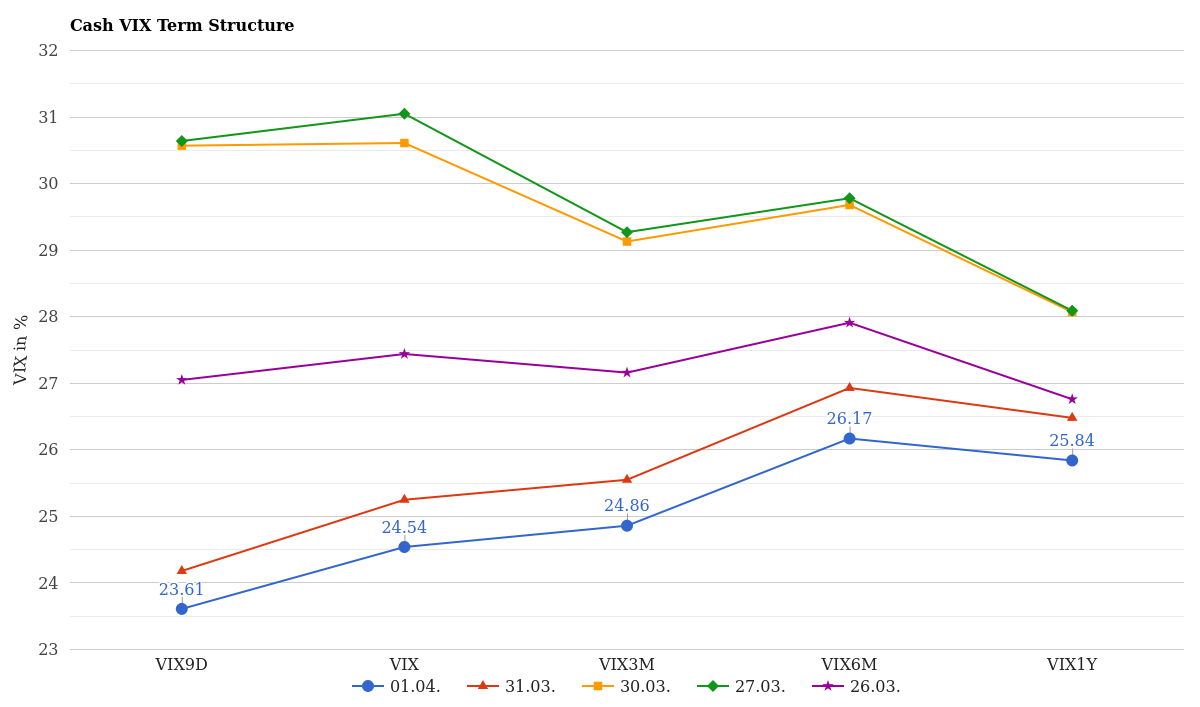
Cash VIX Term Structure (VIX9D to VIX1Y) – Last 5 Days
How Volatility Has Changed This Week
March delivered one of the most volatile stretches in months. Let’s track how the cash VIX curve evolved across the past five trading days:
| Expiry | Apr 1 | Mar 31 | Mar 30 | Mar 27 | Mar 26 | 5-Day Move |
|---|---|---|---|---|---|---|
| April | 24.45 | 25.02 | 28.21 | 28.49 | 26.26 | -1.81 |
| May | 23.91 | 24.41 | 26.45 | 26.49 | 25.10 | -1.19 |
| June | 23.75 | 24.26 | 25.70 | 25.68 | 24.55 | -0.80 |
| Oct | 24.15 | 24.50 | 24.88 | 24.90 | 24.29 | -0.14 |
Every contract across the curve has declined steadily. Near-term expiries (April, May, June) have compressed harder than distant ones, a classic sign of volatility mean reversion. The April contract alone dropped 1.81 points in five trading days, while October barely budged at -0.14.
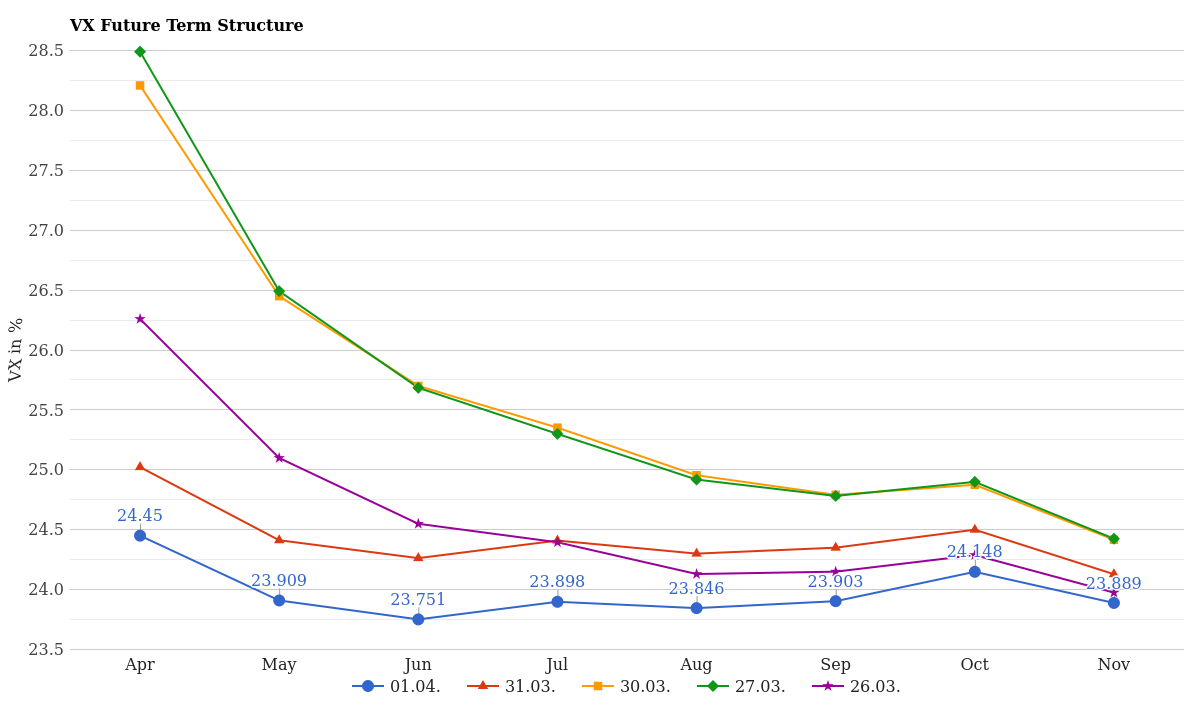
VX Future Term Structure – Last 5 Days
This pattern confirms what the term structure already suggested: traders expect the acute phase of this volatility spike to pass within weeks, but underlying market anxiety will linger well into the second and third quarters.
How Rare Is This VIX Level Historically?
A 24.54 reading is far from unprecedented, but it’s definitely noteworthy. Over the past 12 months, we’ve seen readings at this level or higher on approximately 110+ trading days. The distribution tells an important story about what kind of volatility environment we’re actually in.
| VIX Range | Past 12 Months | YTD 2026 | Frequency |
|---|---|---|---|
| 13-14 | 2 | 4 | Very calm (rare this year) |
| 15-16 | 34 | 7 | Calm / normal baseline |
| 17-20 | 55 | 6 | Elevated (most common zone) |
| 21-25 | 32 | 4 | Stressed (today’s zone) |
| 26+ | 17 | 0 | Crisis mode (not seen yet in 2026) |
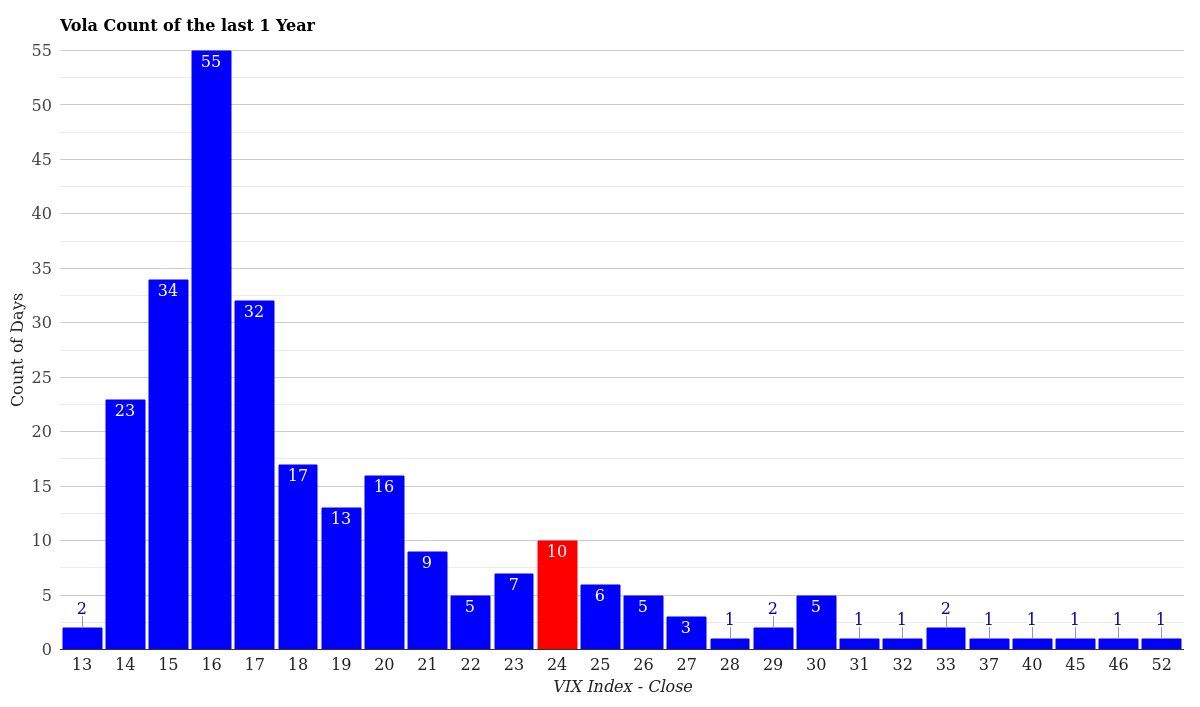
VIX Volatility Distribution – Last 12 Months
The 12-month distribution shows that the 17-20 range has been most common (55 days), but 21-25 has appeared 32 times. Today’s 24.54 places us in the stressed zone but still well below the crisis readings (26+) that occurred just six days ago at the peak of March’s selloff.
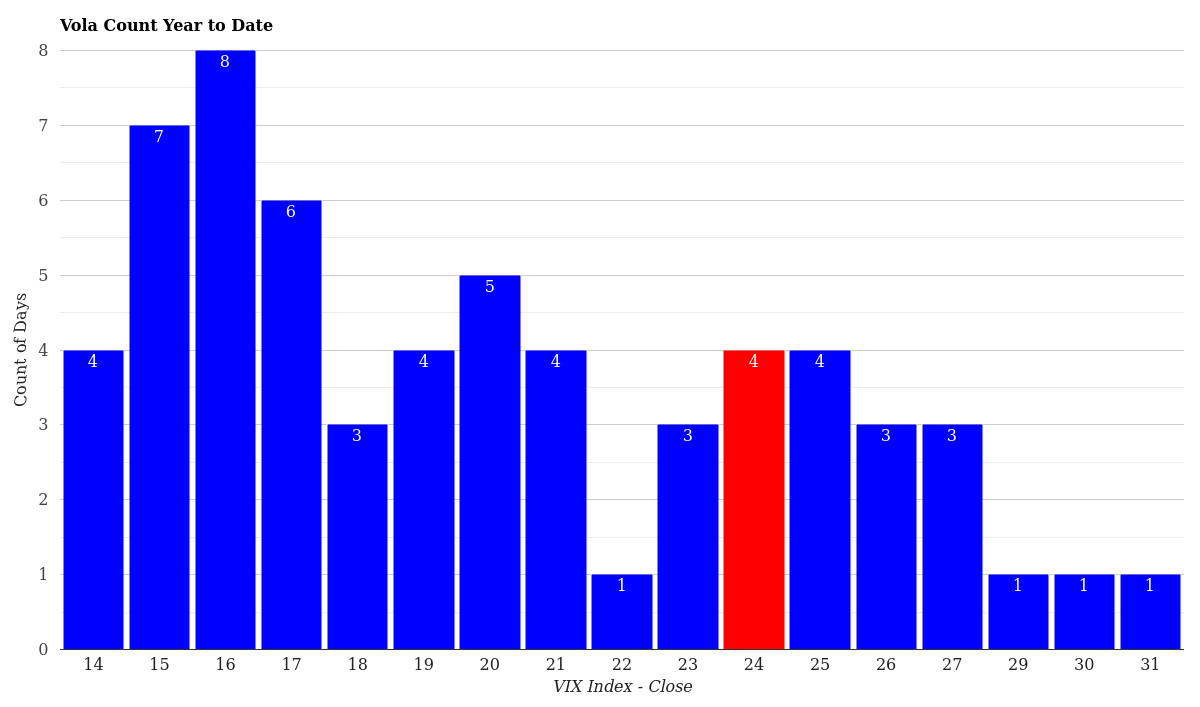
VIX Volatility Distribution – Year to Date
Year-to-date, we’ve only dipped below 15 four times-a sign that 2026 has been a structurally more volatile year than the 12-month average. April is already four trading days in, and we’re seeing volatility normalize rather than intensify, which is a positive signal for the remainder of the month.
What This Means for Traders Right Now
Several tactical insights emerge from today’s data:
1. The worst is likely behind us. March 27 marked the peak at 31.05, and we’ve lost 6.5 points (-21%)** since then. Unless new macro shocks emerge, this relief trend should persist through next week. Watch for support at the 23.00 level-if the VIX breaks below that on a close, expect another leg down toward 20.00.
2. Longer-dated fear hasn’t budged much. The 6-month and 1-year contracts remain stubbornly elevated at 26.17 and 25.84, respectively. This suggests traders aren’t fully convinced we’ve seen the last of volatility this year. Earnings season, Federal Reserve decisions, and geopolitical catalysts loom.
3. The volatility smile favors selling near-term fear, buying far-term. Options traders who sold April volatility and bought June/July are likely profitable on the basis spreads. Conversely, those fighting the term structure (buying near-term over long-term) are underwater. Respect the contango structure.
4. Implied volatility still exceeds realized volatility. A 24.54 VIX implies the S&P 500 will swing roughly 0.8-1.2% per day over the next month. Check actual realized volatility in the underlying-if it’s running 0.5-0.7%, then options are expensive, and long volatility bets are risky.
Conclusion & Market Outlook
The VIX at 24.54 represents a market in recovery, not relapse. The steep pullback from March’s peak signals that whatever triggered the March spike-whether earnings disappointment, Fed concerns, or geopolitical tension-has lost acute impact. Traders are rotating from panic to vigilance, a meaningful but subtle shift.
Watch these levels: Support clusters at 22.00-23.00 (short-term relief threshold) and resistance at 27.00-28.00 (the March trading range ceiling). If the VIX reclaims 25.50+, it suggests the bounce is stalling; if it decisively breaks 21.50, expect momentum toward 18.00-19.00.
The contango structure is your friend right now-it’s telling you the market expects mean reversion but not complacency. Trade accordingly. For deeper historical context and ongoing volatility analysis, browse our daily VIX reports.
For more market analysis, visit stockbotty.com | Disclaimer | Report Date: April 2, 2026
—