
VIX at 24.17: Markets Cooling After March Spike
The VIX currently stands at 24.17, reflecting a market that’s gradually stepping back from the elevated anxiety that gripped investors throughout March. Today’s reading shows volatility has retreated meaningfully from its 31.05 peak just one week ago, signaling that some of the acute fear has begun to dissipate. In this report, we’ll break down what this level means for your portfolio, where volatility is headed next, and which price levels matter most for traders right now.
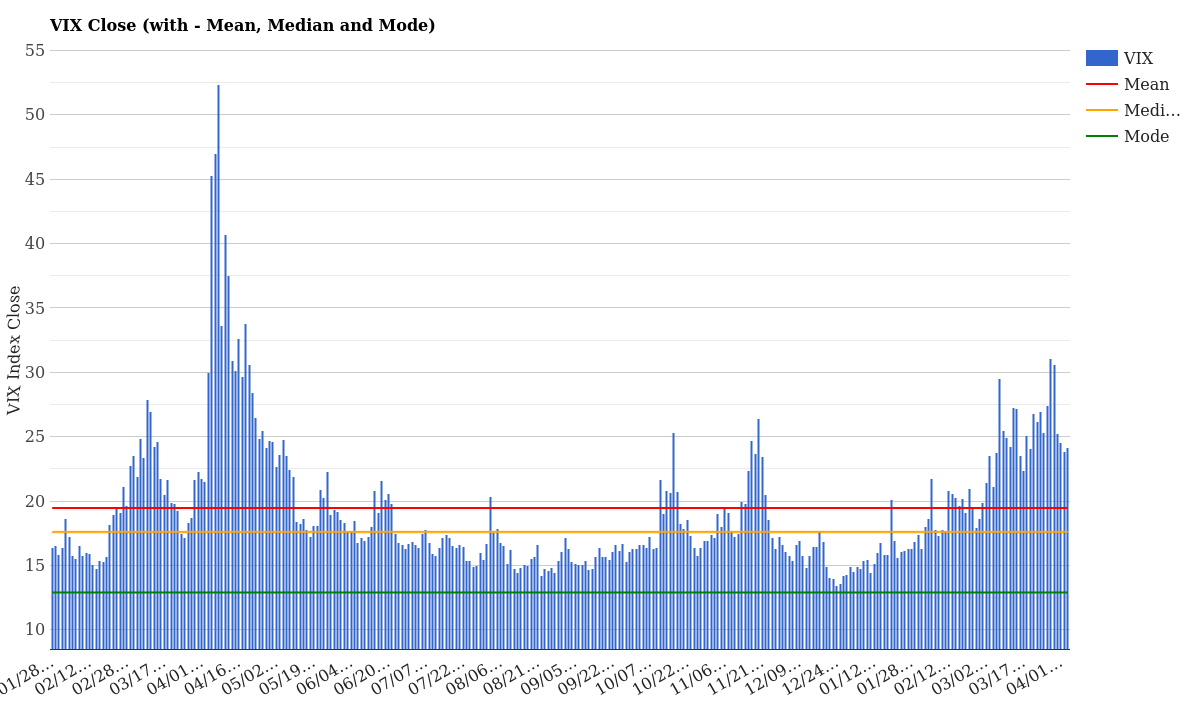
VIX Close with Mean, Median and Mode – April 07, 2026
What the Current VIX Level Means
At 24.17, the VIX sits comfortably above its two-year average of 19.46-roughly 4.71 points higher. For context, this places today’s reading at the 64.9th percentile of all days over the past year, meaning volatility is elevated but not extreme. The index has climbed just 0.30 points (+1.26%) since yesterday’s close, a modest uptick after a week of significant declines.
Here’s what matters: the 24-level has historically served as a psychological barrier between “elevated but manageable” and “concerning.” We’re sitting right on that line. Markets aren’t panicking, but they’re not complacent either. Investors are pricing in genuine uncertainty, likely tied to economic data, earnings concerns, or geopolitical developments that emerged in late March.
| Metric | Value | Assessment |
|---|---|---|
| VIX Close Today | 24.17 | Above Mean, Elevated |
| 2-Year Mean | 19.46 | Historical Average |
| 2-Year Median | 17.24 | Typical VIX Level |
| Daily Change | +0.30 (+1.26%) | Slight Rise |
| 5-Day Change | -6.44 (-21.04%) | Strong Decline |
| 1-Year Percentile | 64.9th | Elevated vs Year |
The big story this week? The five-day decline of 6.44 points shows real relief flowing into equities. That’s a 21% pullback in just five trading days-a meaningful pivot after March’s volatility surge topped out near 31.
VIX Term Structure: Short-Term vs Long-Term Fear
Look at how the market views fear across different time horizons, and you’ll see a crucial insight. Short-term anxiety (the nine-day VIX) sits at 23.90, while the one-year view has crept up to 25.62. This is textbook contango-the normal, healthy structure where longer-dated fear is pricier than immediate fear.
Contango matters because it tells us markets aren’t in acute panic mode. If traders genuinely believed catastrophe was imminent, the nine-day VIX would spike well above the one-year contract. Instead, we’re seeing a gradual upslope, suggesting concerns are real but diffuse-not concentrated in the next few days. For a full explanation of the VIX and how futures work, see our complete VIX guide.
| Contract | Today (04/06) | 5 Days Ago (04/01) | Change |
|---|---|---|---|
| VIX 9-Day | 23.90 | 23.61 | +0.29 |
| VIX Spot (Current) | 24.17 | 24.54 | -0.37 |
| VIX 3-Month | 24.77 | 24.86 | -0.09 |
| VIX 6-Month | 25.82 | 26.17 | -0.35 |
| VIX 1-Year | 25.62 | 25.84 | -0.22 |
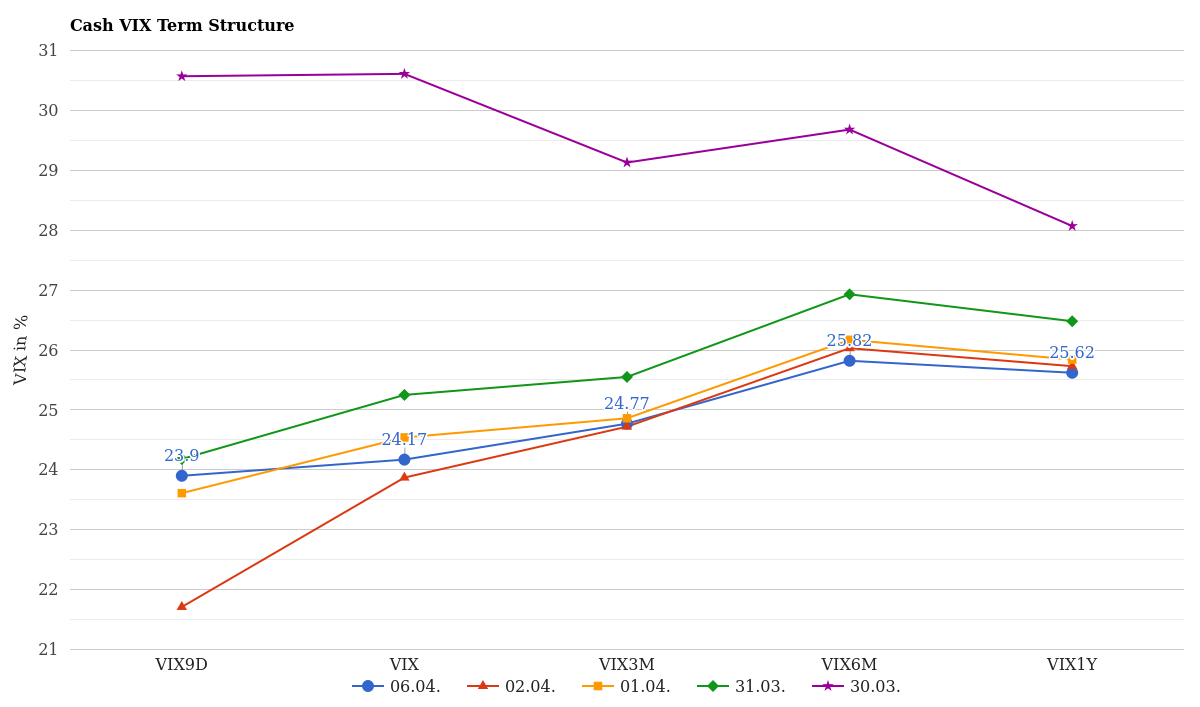
Cash VIX Term Structure (VIX9D to VIX1Y) – Last 5 Days
Notice that the entire curve has shifted down over the past five days. Every maturity from nine-day through one-year has declined, with the 6-month contract dropping 0.35 points. This wholesale repricing downward is the market’s way of saying: “The acute crisis has passed; we can relax a bit.”
The slope between 9-day (23.90) and 1-year (25.62) is a comfortable 1.72 points-reasonable premium for longer-duration risk. Traders aren’t flattening or inverting the curve, which would signal genuine dread.
How Volatility Has Changed This Week
Let’s zoom out and track the cash VIX across the past week. On March 30th, the index was screaming at 28.21. By April 1st, it had moderated slightly to 24.45. Today’s 24.17 shows we’re nearing the end of the correction down from that spike.
| Date | April VIX | May VIX | June VIX | July VIX |
|---|---|---|---|---|
| Today (04/06) | 23.84 | 23.31 | 23.28 | 23.53 |
| 04/02 | 24.48 | 23.95 | 23.70 | 23.83 |
| 04/01 | 24.45 | 23.91 | 23.75 | 23.90 |
| 03/31 | 25.02 | 24.41 | 24.26 | 24.41 |
| 03/30 | 28.21 | 26.45 | 25.70 | 25.35 |
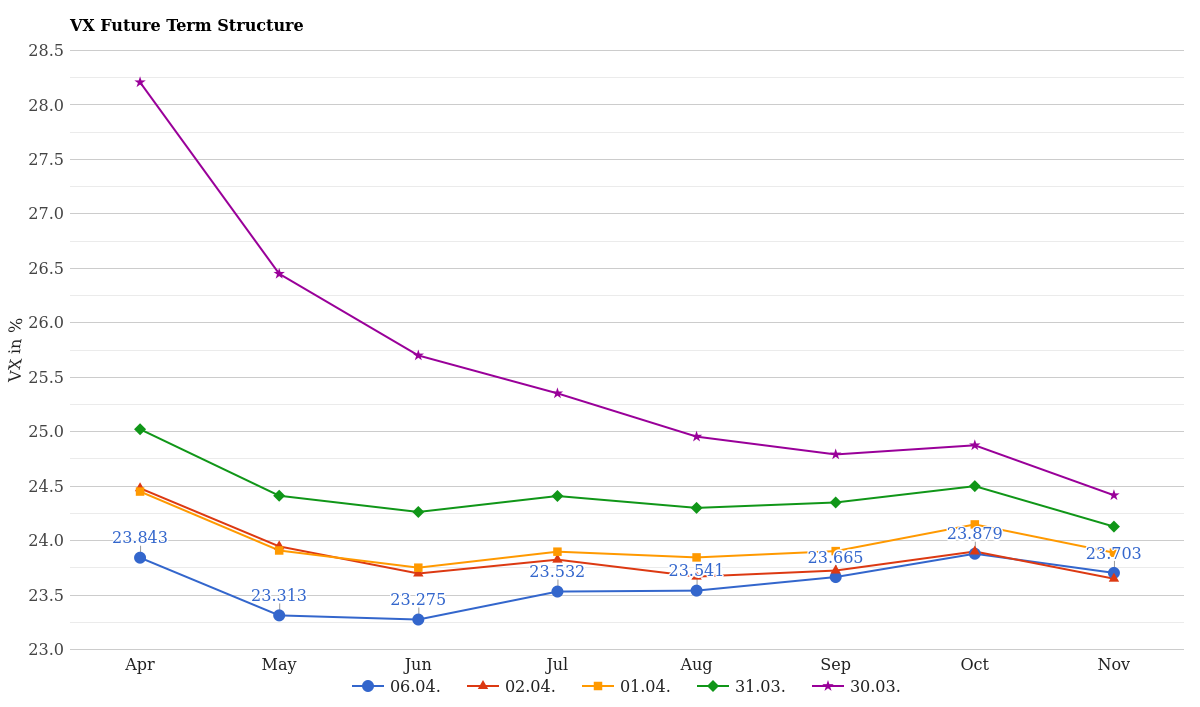
VX Future Term Structure – Last 5 Days
The April contract is down 4.37 points from March 30th-a substantial drop signaling that the market has absorbed whatever shock hit in late March. Every maturity from April through July shows the same pattern: sharp declines across the board, with May, June, and July all pulling back between 2.1 and 3.2 points.
What’s particularly revealing is that the decline is fairly uniform across the curve. This suggests the selloff wasn’t surgical-it wasn’t just near-term fear evaporating. Rather, investors globally repriced their outlook, lowering expectations for volatility across the entire horizon. That’s the sign of a genuine sentiment shift, not just algorithmic mean reversion.
How Rare Is This VIX Level Historically?
At 24.17, we’re asking: where does this rank in recent history? The answer is illuminating. Over the past year, only 64.9% of trading days saw VIX levels lower than today’s close. Said differently, roughly one in three days experienced higher volatility. But year-to-date, we rank at the 100th percentile-every day so far in 2026 has had lower volatility than today.
That’s remarkable and says a lot about the March volatility spike. The entire first two months of 2026 saw a much calmer regime. March changed everything.
| VIX Level | Days in Past Year | Frequency % | Interpretation |
|---|---|---|---|
| 13-14 | 2 | 0.79% | Extreme Calm (Rare) |
| 15-16 | 34 | 13.49% | Low Volatility (Common) |
| 17-18 | 55 | 21.83% | Baseline (Most Common) |
| 19-20 | 32 | 12.70% | Elevated |
| 21-24 | 55 | 21.83% | Moderately Elevated (TODAY) |
| 25-30 | 29 | 11.51% | High Volatility (Rare) |
| 30+ | 5 | 1.98% | Panic (Very Rare) |
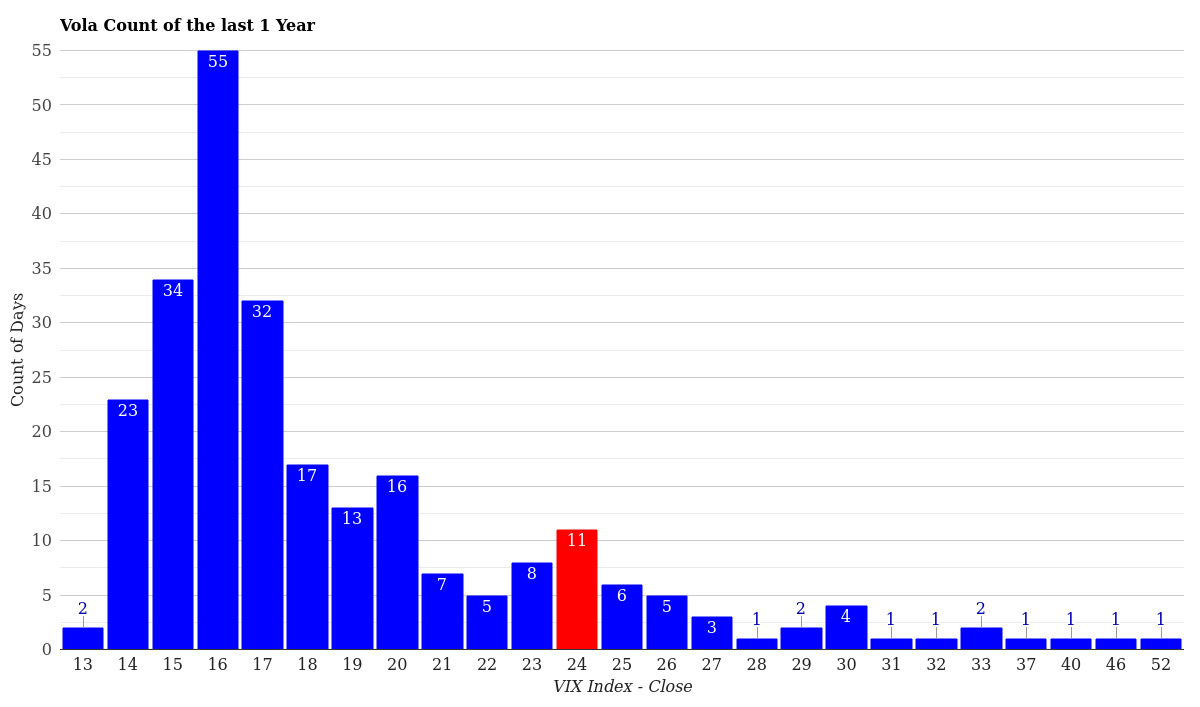
VIX Volatility Distribution – Last 12 Months
Interestingly, the 21-24 range (where we sit today) accounts for 21.83% of all trading days in the past year. That makes today’s level surprisingly common-not exotic at all. For comparison, extreme calm (VIX 13-14) only happened 2 days last year. Panic spikes (VIX above 30) occurred just 5 days.
Year-to-date, the picture is more dramatic. Every single trading day from January 2 through early April has been calmer than today. The March volatility spike was a genuine outlier event-something that broke the pattern of 2026’s otherwise serene tape.
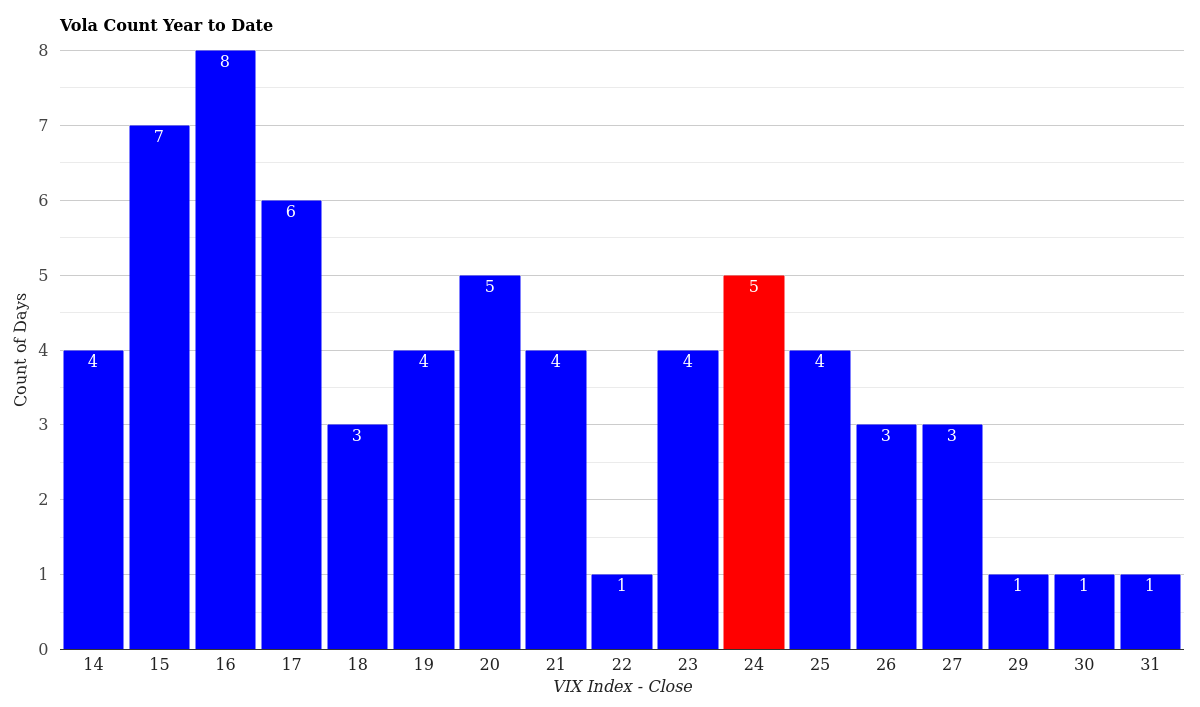
VIX Volatility Distribution – Year to Date
What This Means for Traders Right Now
If you’re running a portfolio, here’s the practical takeaway: volatility has normalized, but it hasn’t returned to the sleepy levels we saw in January and February. You’re no longer in panic mode, but you’re not in complacency mode either.
For mean reversion traders, the question is whether 24.17 continues down toward the 19-20 range (more typical), or whether we stabilize in the 23-25 band for a while. The contango structure suggests markets expect volatility to drift higher over longer horizons, not crash to 12-year lows. Watch for support around 23 and resistance near 25.50.
Options traders should note the term structure is reasonably healthy. Contango allows for positive theta decay in long volatility positions, but the slope isn’t steep enough to offer easy money from selling front-month volatility. The 1.72-point gap between 9-day and 1-year contracts is fair value for rollover costs.
Risk-asset allocators might interpret today’s reading as “the worst is over, but caution remains.” A 24 VIX is not a green light for maximum equity exposure-it’s more of a yellow light. Stay hedged. The fact that every maturity contracts year-to-date suggests the market is slowly repricing expectations, not exploding higher.
Conclusion & Market Outlook
The VIX at 24.17 tells a story of transition. March’s anxiety spike has faded, but it left its mark. Investors are no longer in acute panic, yet they’re not dismissing risks entirely. The healthy contango structure and uniform decline across the curve suggest this is organic repricing-markets digesting bad news and moving forward, not algorithmic mean reversion into complacency.
Watch the 23-level closely over the next few sessions. A break below signals confidence is returning. A bounce back above 26 would suggest the March concerns aren’t fully resolved. Either way, the elevated but stabilizing regime we’re in now is likely to persist through early April.
For ongoing volatility analysis and historical context, browse our daily VIX reports covering major market events and volatility regimes throughout the year.
Disclaimer: This article is for informational purposes only and does not constitute financial or investment advice. All data is historical and statistical. Past performance is not indicative of future results. Volatility indices are subject to rapid change, and trading derivatives carries substantial risk of loss. Consult a qualified financial advisor before making investment decisions.
Author Disclosure: The author may hold or has held positions in VIX-related instruments directly or through derivative constructs at the time of publication. This is not a trading recommendation. All views expressed are analytical and for educational use only.
For more market analysis, visit stockbotty.com | Disclaimer & Terms