
VIX at 23.87: Markets Shift Gears as Volatility Cools
The VIX currently stands at 23.87, down 0.67 points (-2.73%) from yesterday’s close. After an intense spike that pushed volatility to multi-year highs just weeks ago, we’re seeing the early stages of a calm. Today’s report breaks down what this level means, where the market’s short-term and long-term fear gauges differ, and what traders should watch in the coming sessions.
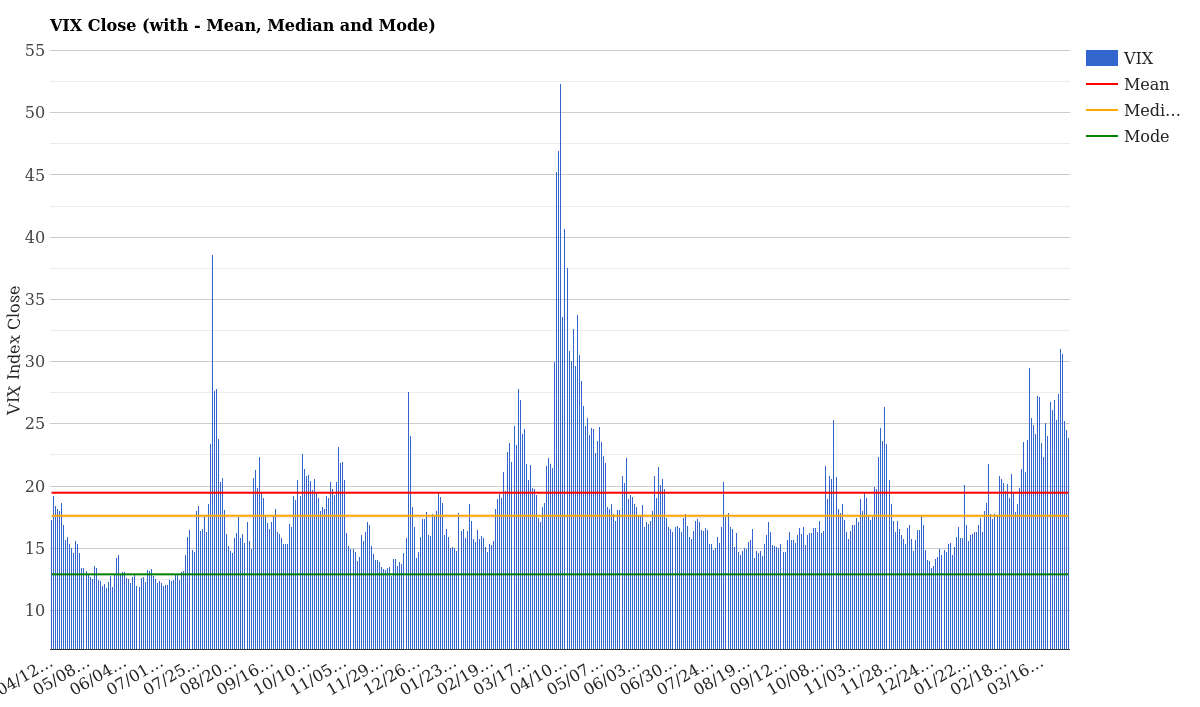
VIX Close with Mean, Median and Mode – April 03, 2026
What the Current VIX Level Means
At 23.87, the VIX sits comfortably above its two-year mean of 19.46 but significantly lower than the panic levels we witnessed just a few weeks ago when it spiked above 50. This is elevated volatility-no question-but it’s the kind of elevated that suggests the market is processing risk rather than panicking about it.
Compared to historical benchmarks, today’s reading places volatility at the 59.5th percentile over the past year, meaning more days saw lower VIX readings than higher ones. Year-to-date, however, we’re at the 100th percentile-a reminder that 2026 has been notably choppy compared to the average historical day.
| Metric | Value | Interpretation |
|---|---|---|
| VIX Close | 23.87 | Above mean – elevated but stabilizing |
| Daily Change | -0.67 (-2.73%) | Downward momentum – positive signal |
| 5-Day Change | -7.18 (-23.12%) | Strong weekly decline – fear subsiding fast |
| vs. 2-Year Mean | +4.41 points | Moderately above normal – still risk-aware |
| vs. 2-Year Median | +6.63 points | Above the middle ground – caution warranted |
| 1Y Percentile | 59.5% | Slightly above median – not extreme historically |
| YTD Percentile | 100.0% | 2026 has been volatile – context matters |
In plain terms: 23.87 signals a market that’s alert but not alarmed. Traders are pricing in uncertainty, but we’re past the acute panic phase that defined late March. For a full explanation of the VIX and what the VIX measures, check our complete guide.
VIX Term Structure: Short-Term vs Long-Term Fear
One of the most revealing aspects of volatility markets is how the term structure looks-in other words, whether fear is concentrated in the next few weeks or spread across months and years. Today shows a textbook contango structure, meaning longer-dated fear is higher than near-term fear. This is the market’s default healthy state.
| VIX Futures Contract | Price | Time Horizon |
|---|---|---|
| VIX9D | 21.71 | 9 days – near term is calm |
| VIX (Cash) | 23.87 | Today – current market fear |
| VIX3M | 24.72 | 3 months – lingering uncertainty |
| VIX6M | 26.03 | 6 months – elevated base case |
| VIX1Y | 25.73 | 1 year – structural risk priced in |
Notice the upward slope: 21.71 → 23.87 → 24.72 → 26.03 → 25.73. The fact that 6-month and 1-year contracts trade at 26+ while the 9-day contract sits at 21.71 tells us something important. Traders expect the immediate turbulence to settle, but they’re building in a higher structural volatility premium for the rest of the year.
This is neither bullish nor bearish-it’s realistic. Markets always price in more uncertainty the farther out you look. What matters is that we’re not seeing inverted volatility curves (where near-term fear exceeds long-term fear), which would signal panic.
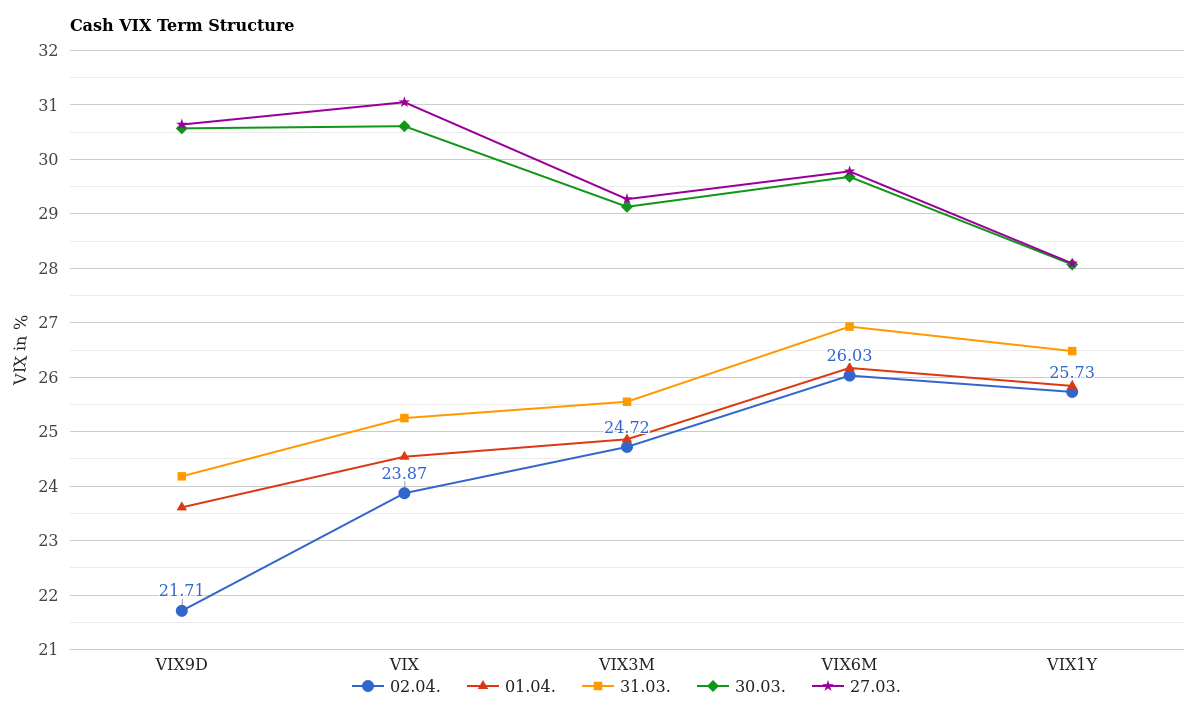
Cash VIX Term Structure (VIX9D to VIX1Y) – Last 5 Days
How Volatility Has Changed This Week
The five-day picture matters more than you might think. A 23.12% drop over just five trading days represents real momentum-and it’s worth tracking whether this decline has legs or exhausts itself at current levels.
| Date | April VIX | May VIX | Jun VIX | Status |
|---|---|---|---|---|
| Apr 02 | 24.48 | 23.95 | 23.70 | Today – calming trend |
| Apr 01 | 24.45 | 23.91 | 23.75 | Slight uptick |
| Mar 31 | 25.02 | 24.41 | 24.26 | Earlier decline phase |
| Mar 30 | 28.21 | 26.45 | 25.70 | Peak of recent spike |
| Mar 27 | 28.49 | 26.49 | 25.68 | Spike beginning |
The pattern is unmistakable: volatility peaked around March 27-30 at 28.5 across the curve, and we’ve been in steady decline since. The April contract has fallen from 28.49 to 24.48-a 14% drop in just six calendar days. That’s real mean reversion at work.
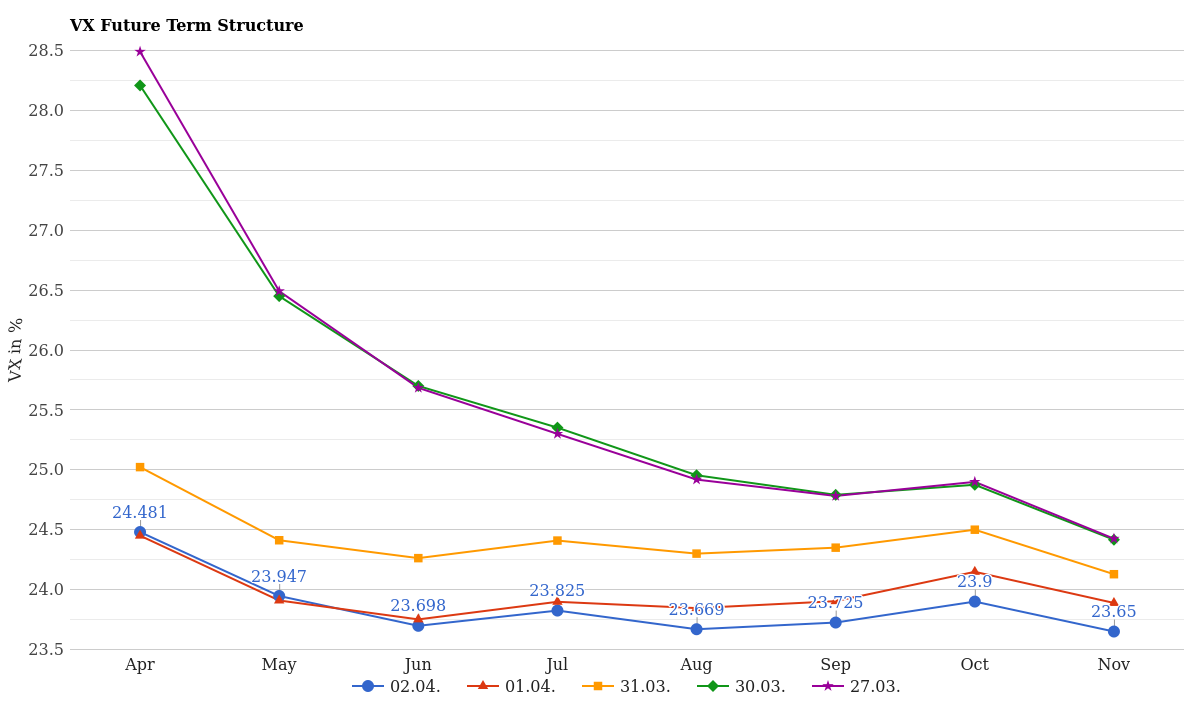
VX Future Term Structure – Last 5 Days
How Rare Is This VIX Level Historically?
Perspective is everything in volatility trading. Is 23.87 rare? By one-year standards, no. By 2026 standards, it’s becoming increasingly normal as we’ve moved away from late March extremes.
Looking at the one-year volacount (how many days the VIX closed at each level), we can see where 23.87 falls in the distribution:
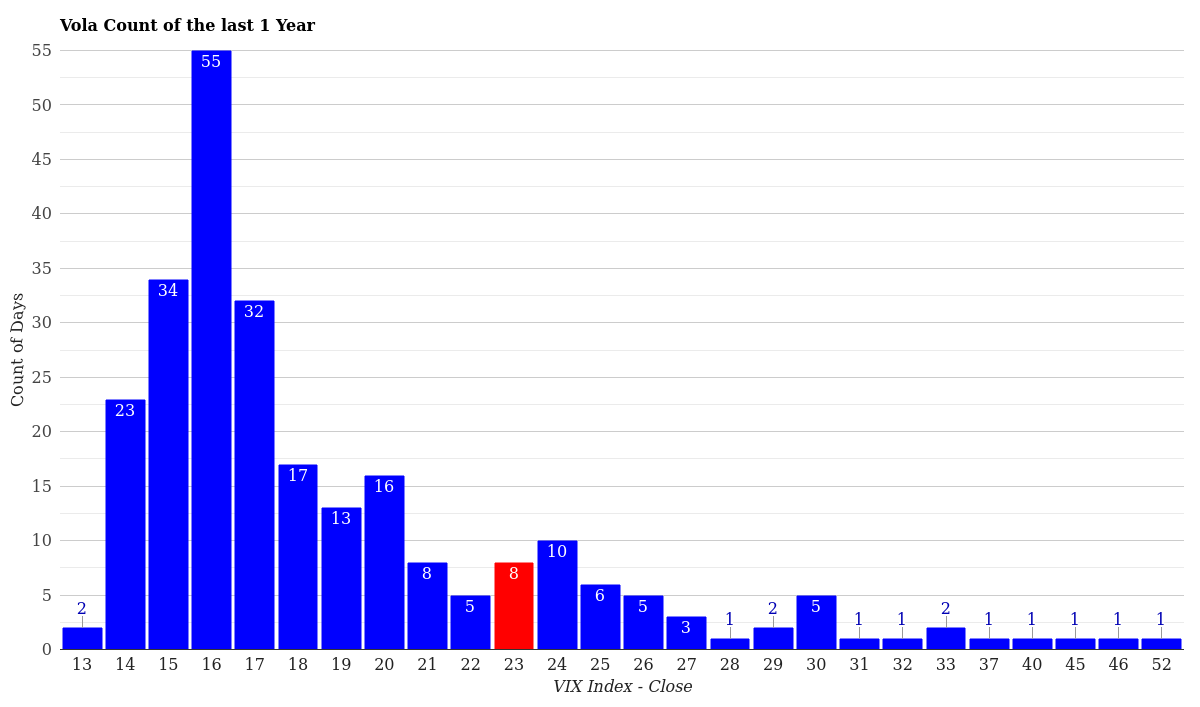
VIX Volatility Distribution – Last 12 Months
Over 252 trading days, the VIX spent significant time in the 16-17 range (peak frequency at 55 days), with 23 occurring on 8 days. What’s striking about 2026 is the tail risk-we’ve had multiple days above 30, with one day hitting 52.33 in April, and a smattering of extreme readings (45, 46, 52) that tell the story of the mid-April volatility bomb.
Year-to-date data shows even fewer days at the 23 level, meaning we’re still in a period where this reading carries more weight than it would in a typical year.
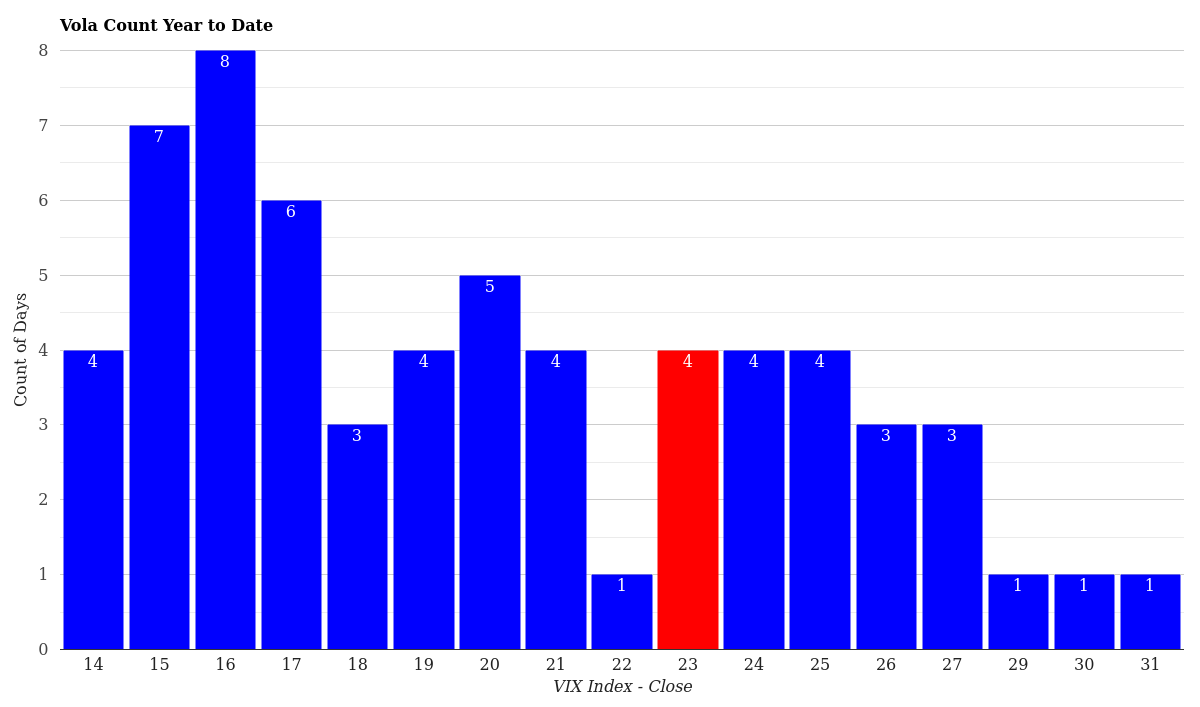
VIX Volatility Distribution – Year to Date
In short: 23.87 is elevated but not historically extreme. It’s the kind of reading that appears maybe 5-10% of the time in normal markets, but we’re not in a normal year-and that context matters for positioning.
What This Means for Traders Right Now
The data points to a few actionable takeaways for traders managing volatility exposure:
1. Contango is your friend right now. The term structure shows healthy upward slope. If you’re long volatility, selling front-month contracts and holding longer-dated ones is a viable strategy. If you’re short volatility, be cautious of near-term spikes-your hedge is expensive, but it’s warranted.
2. The downtrend has momentum but needs confirmation. A 23.12% five-day decline is substantial. However, we’re still +4.41 above the two-year mean. Support will likely emerge around 22-23. If we break below 21, we’re signaling genuine risk-off sentiment and a reversion toward normalcy.
3. Watch the 9-day contract closely. At 21.71, it’s already pricing in calm for the immediate week. This is where your real-time market signal lives. If that contract starts climbing, expect sudden repricing across the curve. Conversely, if it holds below 22, the next week should remain relatively orderly.
4. YTD context is critical for mean reversion trades. Because we’re at the 100th percentile year-to-date, any dip below 20 would be statistically significant. Current levels are “elevated but not shocking”-which is where tactical volatility sellers can deploy capital, but only with tight stops.
Conclusion & Market Outlook
At 23.87, the VIX has moved decisively away from panic mode and into a more sustainable risk-aware environment. The contango structure tells us traders are prepared for continued choppy conditions over the next six months, but immediate danger is fading. The five-day decline shows momentum, but we’re not yet back to normal.
For the next session, watch whether the 9-day contract holds above 21 and whether cash volatility can sustain a close below 23.50. A break of either level would be technically significant and could accelerate the reversion trend.
Browse our daily VIX reports for historical volatility context and longer-term trend analysis to complement today’s reading.
For more market analysis visit stockbotty.com |
Disclaimer