
VIX at 19.23: Markets Cooling After Week of Intense Selling
The VIX currently stands at 19.23, down 0.26 points from yesterday and significantly lower than the 24.99 peak seen just five days ago. After a brutal stretch that saw volatility spike into the low 40s in early April, equity markets are finally catching their breath. This report breaks down what today’s reading means, where fear is heading next, and what traders should watch in the coming weeks.
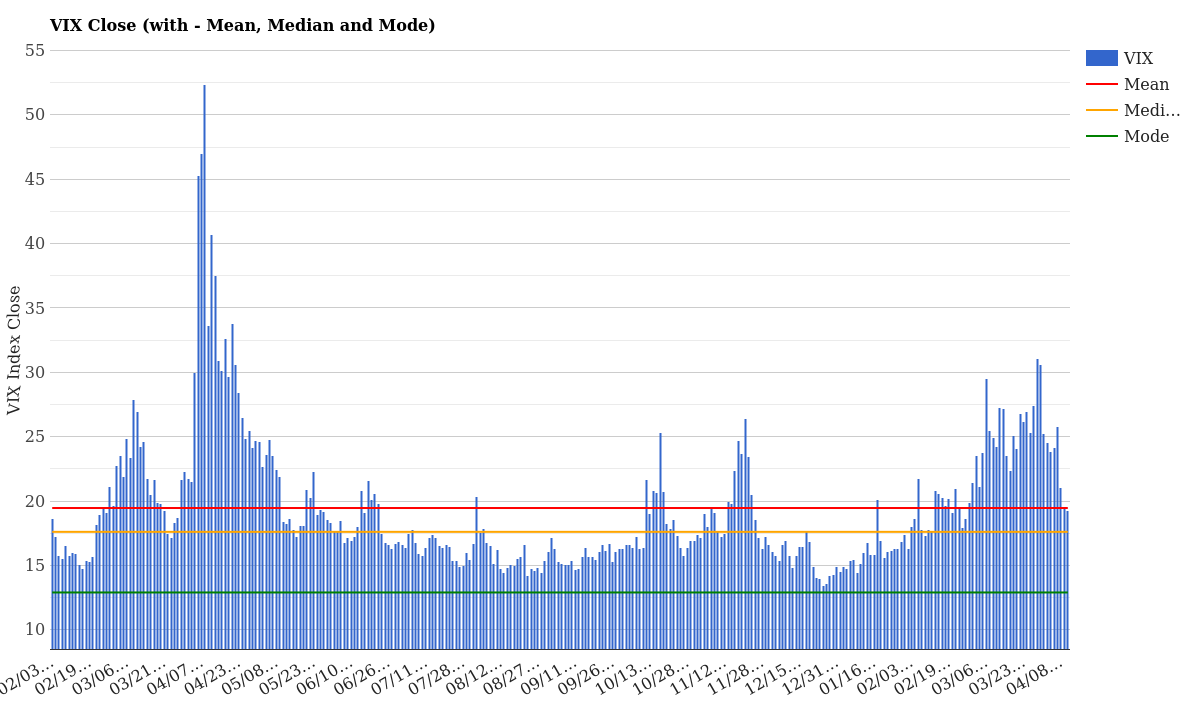
VIX Close with Mean, Median and Mode – April 11, 2026
What the Current VIX Level Means
At 19.23, the VIX sits just slightly below its two-year mean of 19.46 and comfortably above the median of 17.24. This is healthy middle ground-neither excessively calm nor alarm-bell territory.
| Metric | Value | Interpretation |
|---|---|---|
| VIX Close | 19.23 | Below mean, normal range |
| 2Y Mean | 19.46 | Historic average |
| 2Y Median | 17.24 | Middle point of distribution |
| Daily Change | -0.26 (-1.33%) | Slight relief |
| 5-Day Change | -4.94 (-20.44%) | Significant pullback |
| 1Y Percentile | 40th | Below average volatility |
What does this mean in practical terms? Markets are no longer panicked. Traders aren’t scrambling to buy protective options, and the “fear premium” that was visible two weeks ago has evaporated. This is the kind of level where long-term investors feel reasonably comfortable, while short-term traders stay alert to the possibility of another spike.
For a full explanation of the VIX and how futures work, see our complete VIX guide.
VIX Term Structure: Short-Term vs Long-Term Fear
The term structure tells us something crucial: where do traders expect volatility to be weeks and months from now? Today’s curve reveals confidence in gradual stabilization.
| Contract | Today (04/10) | Yesterday (04/09) | Timeframe |
|---|---|---|---|
| VIX9D | 16.36 | 16.81 | 9 days ahead |
| VIX (spot) | 19.23 | 19.49 | Today |
| VIX3M | 21.86 | 21.81 | 3 months |
| VIX6M | 23.51 | 23.39 | 6 months |
| VIX1Y | 24.25 | 24.11 | 1 year |
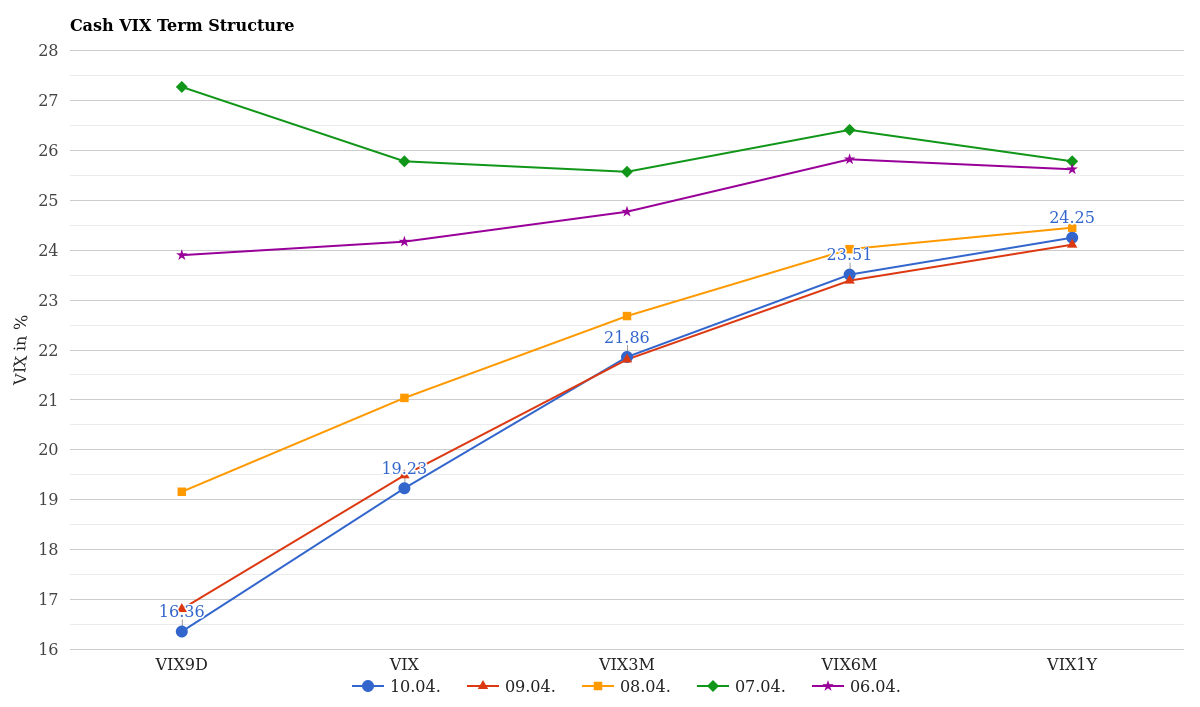
Cash VIX Term Structure (VIX9D to VIX1Y) – Last 5 Days
Notice the upward slope: 16.36 → 19.23 → 21.86 → 23.51 → 24.25. This is textbook contango-the market’s way of saying “we expect things to calm down in the next week or so, but longer-term uncertainty remains elevated.”
Why does this matter? Contango benefits long-volatility traders (those betting on fear to rise) because they naturally lose money as contracts roll forward. For equity traders, it means the market isn’t pricing in an imminent crash, but officials remain cautious about the intermediate outlook through summer.
How Volatility Has Changed This Week
Last Friday (April 4), the VIX closed near 23.84. By Monday morning, it had spiked to 45.31-a jolt that caught many traders off guard. Here’s the five-day breakdown:
| Date | VIX Close | Daily Change | Status |
|---|---|---|---|
| Apr 06 (Sun) | 23.84 | – | Pre-shock |
| Apr 07 (Mon) | 24.98 | +1.14 | Opening spike |
| Apr 08 (Tue) | 21.67 | -3.31 | Pullback |
| Apr 09 (Wed) | 19.49 | -2.18 | Strong recovery |
| Apr 10 (Thu) | 19.23 | -0.26 | Consolidation |
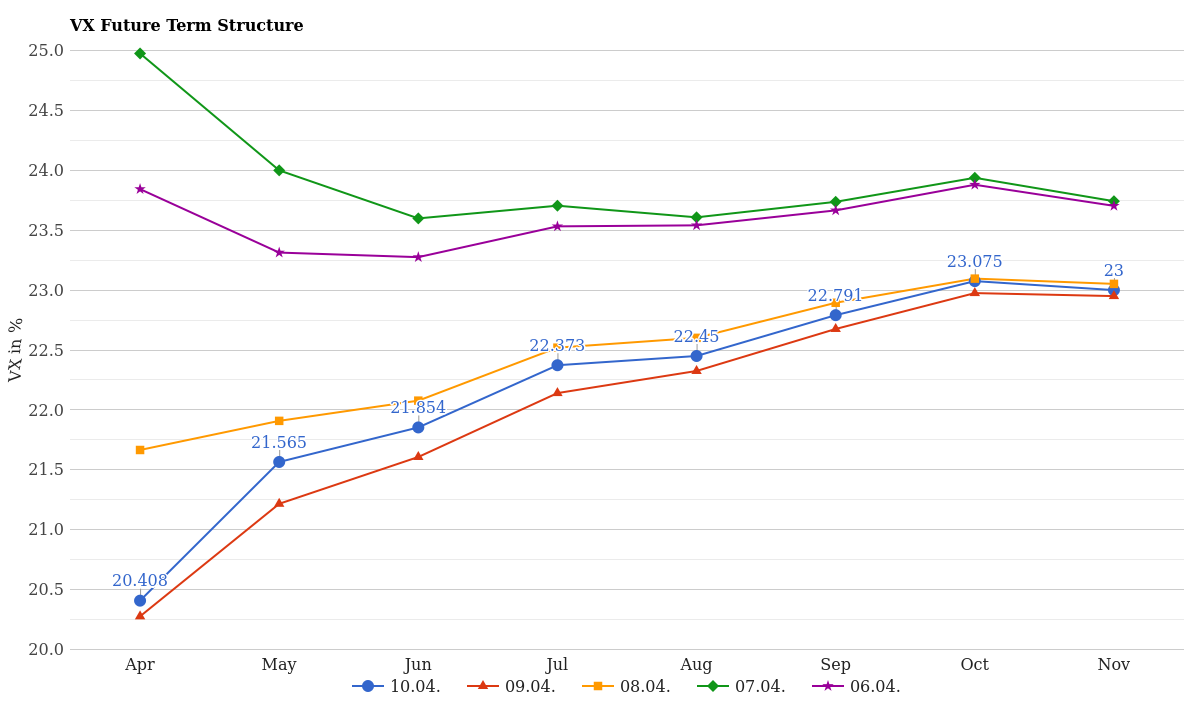
VX Future Term Structure – Last 5 Days
The headline? Volatility crashed over 5.75 points in just two days (Tuesday-Wednesday), erasing almost half of Monday’s panic surge. What started as a scary selloff has morphed into a healthy correction. That’s exactly how volatile markets are supposed to behave-sharp moves followed by mean reversion.
How Rare Is This VIX Level Historically?
At 19.23, today’s reading ranks in the 40th percentile of all trading days over the past year. That means roughly 60% of days were calmer than today. It’s not quiet, but it’s definitely not extreme.
Looking at the one-year volatility distribution, the most common VIX closing range remains 16-17 (the blue cluster on the histogram below). We see occasional spikes into the 19-20 range, and rare explosions above 30. Today sits right at the edge of normal-a transition zone.
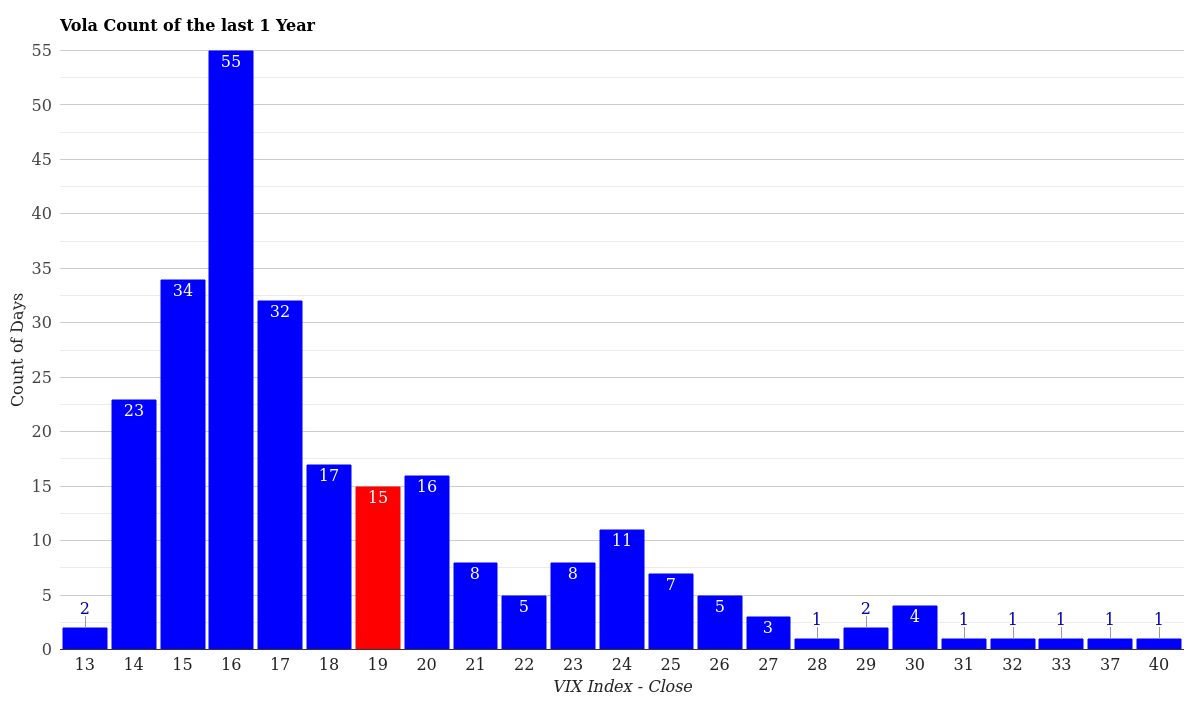
VIX Volatility Distribution – Last 12 Months
Year-to-date, the pattern is even starker. The early-April volatility event that sent the VIX into the 40s was a genuine outlier. Most YTD trading has clustered between 14 and 21.
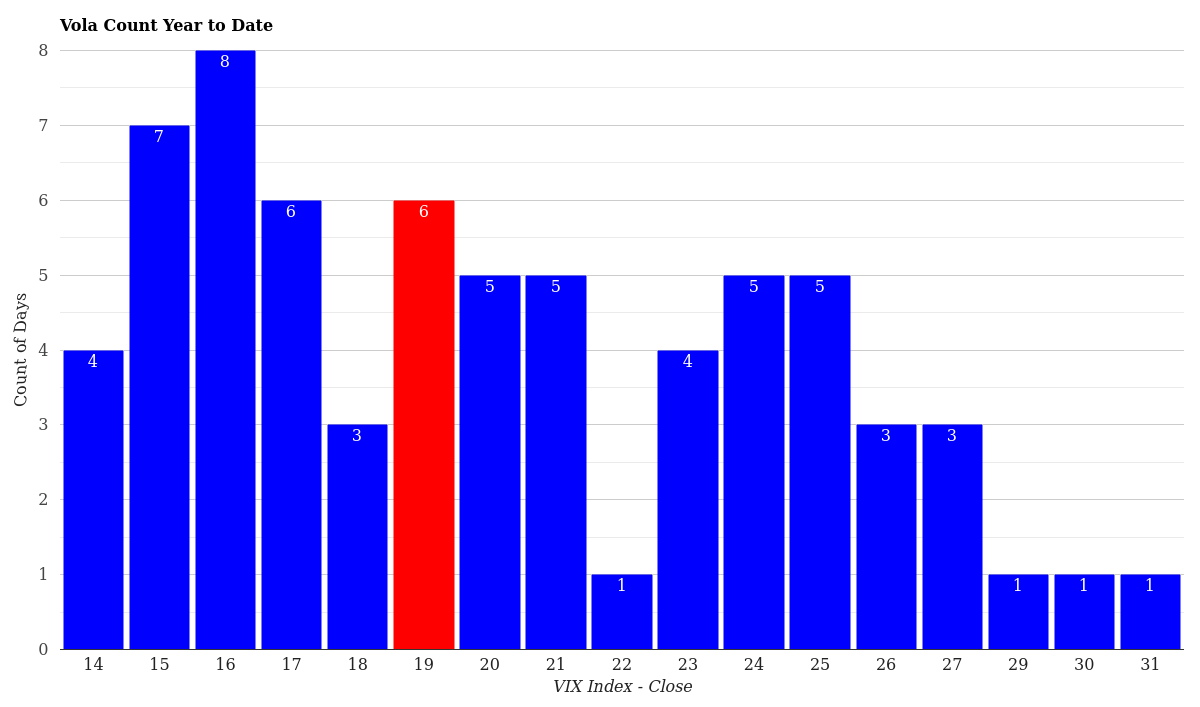
VIX Volatility Distribution – Year to Date
Bottom line: today’s level isn’t rare or noteworthy from a statistical perspective. It’s the calm after the storm-and markets are acting like it.
What This Means for Traders Right Now
Current environment tilts slightly bullish for equity buyers. A VIX below 20 historically correlates with higher equity prices and lower hedging urgency. Protective puts become cheaper, which tempts portfolio managers to reduce defensive positions and redeploy capital into growth names.
The contango curve tells us traders aren’t betting on a sudden relapse. However, the “elevated” longer-term readings (VIX1Y at 24.25) suggest no one is complacent about the next six months. Earnings season will be crucial-any disappointment could easily spike volatility back into the 25-30 range.
Key levels to monitor:
Support: If the VIX breaks below 17.50, expect a genuine complacency trade-more equity inflows, tighter spreads. Resistance: A close above 22.00 would signal renewed caution and likely trigger hedging flows. Critical warning: A spike above 28.00 means panic is returning in earnest.
Options traders should pay attention to the widening gap between short-term and long-term volatility. That spread rewards long calls on intermediate equity rallies while punishing naked short volatility positions.
Conclusion & Market Outlook
The VIX at 19.23 tells a simple story: markets have moved from panic to prudence in just four trading days. The violent early-April selloff is being digested, not amplified. Expect consolidation around the 18-22 range through the next two weeks unless earnings disappointments (or geopolitical news) reignite fear.
Longer-term, the upward-sloping term structure suggests investors remain cautious about Q2 and Q3. That’s healthy. A market that can spike hard, recover fast, and maintain measured caution is behaving rationally.
Browse our daily VIX reports for historical volatility context and ongoing analysis of fear gauge trends.
For more market analysis visit stockbotty.com | Disclaimer: stockbotty.com/disclaimer