
VIX at 17.48: Markets Cooling as Fear Index Falls Below Mean
The VIX currently stands at 17.48, marking a reassuring pullback in market anxiety as equities stabilize following recent turbulence. This report breaks down what today’s volatility level means for your portfolio, how the term structure is shaping up, and what historical patterns suggest about the road ahead.
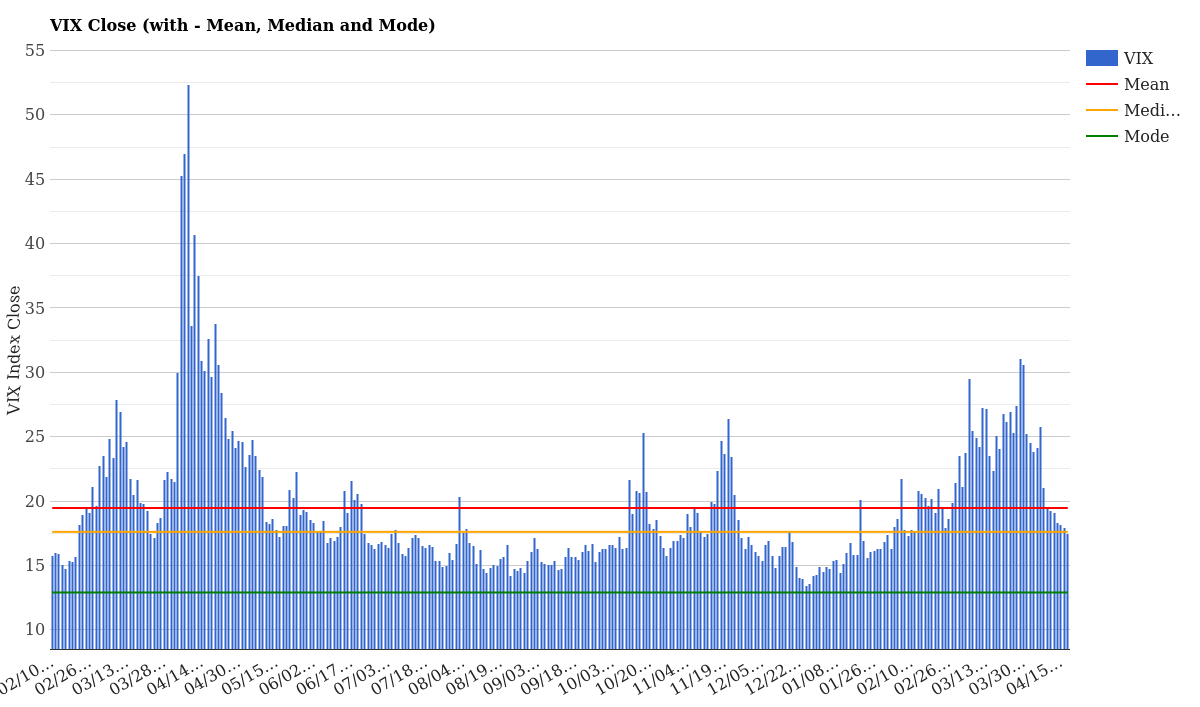
VIX Close with Mean, Median and Mode – April 18, 2026
What the Current VIX Level Means
At 17.48, the VIX has retreated 0.46 points (or 2.56%) from yesterday’s close and sits notably lower than the two-year average of 19.46. This positions today’s reading squarely in “normal market conditions” territory-below the mean but slightly above the median of 17.24. In plain language, investors are breathing easier.
Over the past five trading days, volatility has compressed by 1.64 points (8.58%), signaling that fear is gradually exiting the system after the volatile mid-March spike that peaked above 30. Current levels suggest markets have priced in recent geopolitical and economic concerns without expecting immediate fresh shocks.
| Metric | Value | Status |
|---|---|---|
| VIX Close (Today) | 17.48 | Below Mean ✓ |
| 1-Day Change | -0.46 (-2.56%) | Declining ✓ |
| 5-Day Change | -1.64 (-8.58%) | Strong Downtrend ✓ |
| 2-Year Mean | 19.46 | Current is -1.98 below |
| 2-Year Median | 17.24 | Current is +0.24 above |
| Historical Percentile (1Y) | 27.3% | Relatively calm |
What’s particularly noteworthy: at the 27.3% percentile within the past year, today’s reading falls below 73% of all VIX closes since April 2025. This reinforces the message that current volatility is subdued relative to the dramatic swings we’ve endured over the last twelve months.
VIX Term Structure: Short-Term vs Long-Term Fear
The term structure reveals critical information about how traders expect volatility to evolve. Today’s curve moves from near-term contracts all the way out to one-year expiration, showing us the full picture of fear pricing across time horizons.
| Contract | 04/17 Close | 04/16 Close | Change |
|---|---|---|---|
| VIX9D (9-Day) | 14.81 | 15.46 | -0.65 |
| VIX (Spot) | 17.48 | 17.94 | -0.46 |
| VIX3M (3-Month) | 20.51 | 20.77 | -0.26 |
| VIX6M (6-Month) | 22.57 | 22.78 | -0.21 |
| VIX1Y (1-Year) | 23.66 | 23.94 | -0.28 |
This is a textbook contango structure-each successive contract month trades higher than the previous one. The market is saying: “Today feels calm, but we expect volatility to gradually increase as we look further out.” That’s healthy and normal, reflecting uncertainty that compounds with time.
Cash VIX Term Structure (VIX9D to VIX1Y) – Last 5 Days
The gap between the 9-day contract (14.81) and the one-year contract (23.66) of 8.85 points confirms traders are not pricing in imminent shocks. Instead, they’re booking in a gentle escalation of risk over the next six to twelve months. For a full explanation of the VIX and how futures work, see our complete VIX guide.
How Volatility Has Changed This Week
Zooming out to the cash VIX index curve across the past five trading sessions reveals a steady decline that should comfort equity investors. The index has pulled back consistently, with May contracts dropping from 20.71 to 20.29, and December contracts easing from 22.72 to 22.68.
| Expiry | 04/17 | 04/16 | 04/15 | 5-Day Chg |
|---|---|---|---|---|
| May | 20.29 | 20.50 | 20.59 | -0.42 |
| June | 20.95 | 21.02 | 21.08 | -0.21 |
| September | 22.26 | 22.35 | 22.39 | -0.17 |
| December | 22.68 | 22.73 | 22.83 | -0.05 |
VX Future Term Structure – Last 5 Days
Notice that nearer-term contracts (May) are declining faster than longer-dated ones (December). This is precisely what you want to see in a normalizing market-near-term pressure eases while structural fear remains well-anchored. It’s the market’s way of saying: “We’ve gotten past the immediate panic, but we’re not convinced everything is smooth sailing for the next six months.”
How Rare Is This VIX Level Historically?
History puts today’s reading into sharp perspective. Over the past year, the VIX has closed at or below 17.48 on 239 trading days. That represents roughly 60% of all trading sessions-meaning this level is common and unremarkable by historical standards.
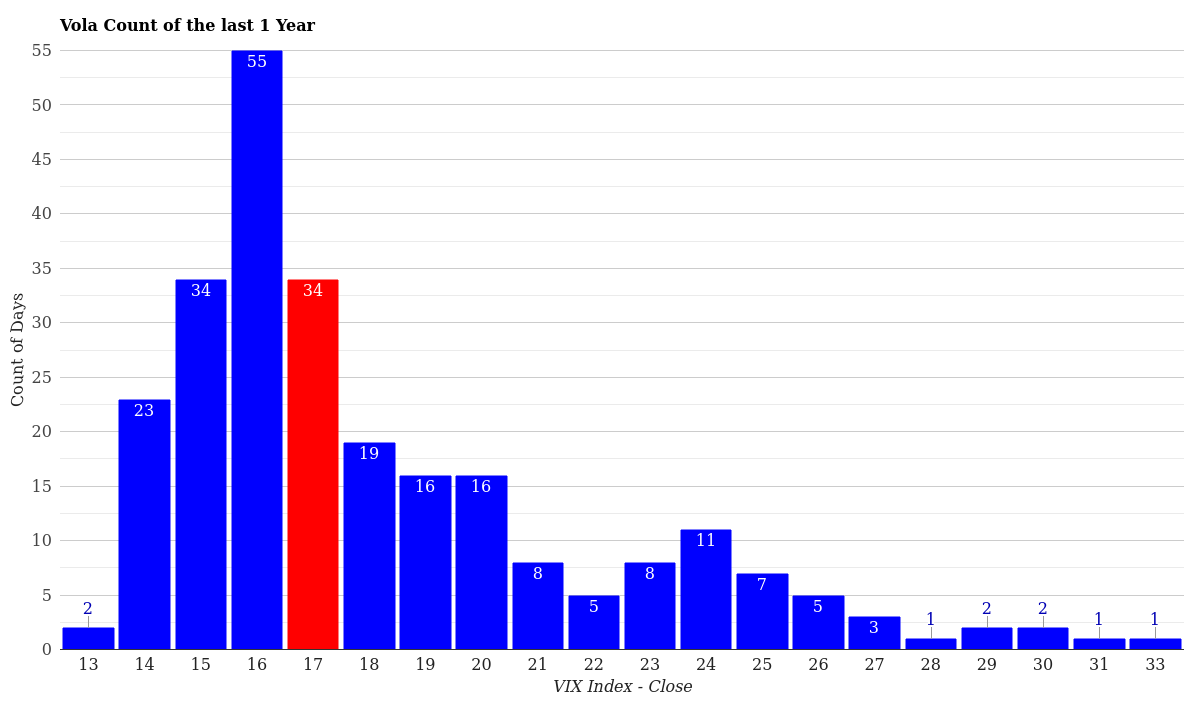
VIX Volatility Distribution – Last 12 Months
The one-year distribution is heavily weighted toward the lower end: 55 days at VIX 16, 34 days at VIX 15, and 23 days at VIX 14. Only 34 days in the past year have seen VIX above 20, a testament to how much time markets spend in “normal” conditions versus stress.
Year-to-date in 2026, we’ve had only 8 days at exactly 17-the most common closing level so far this year. This tight clustering in the 14-17 range reflects the market’s attempt to find equilibrium after the volatile first quarter.
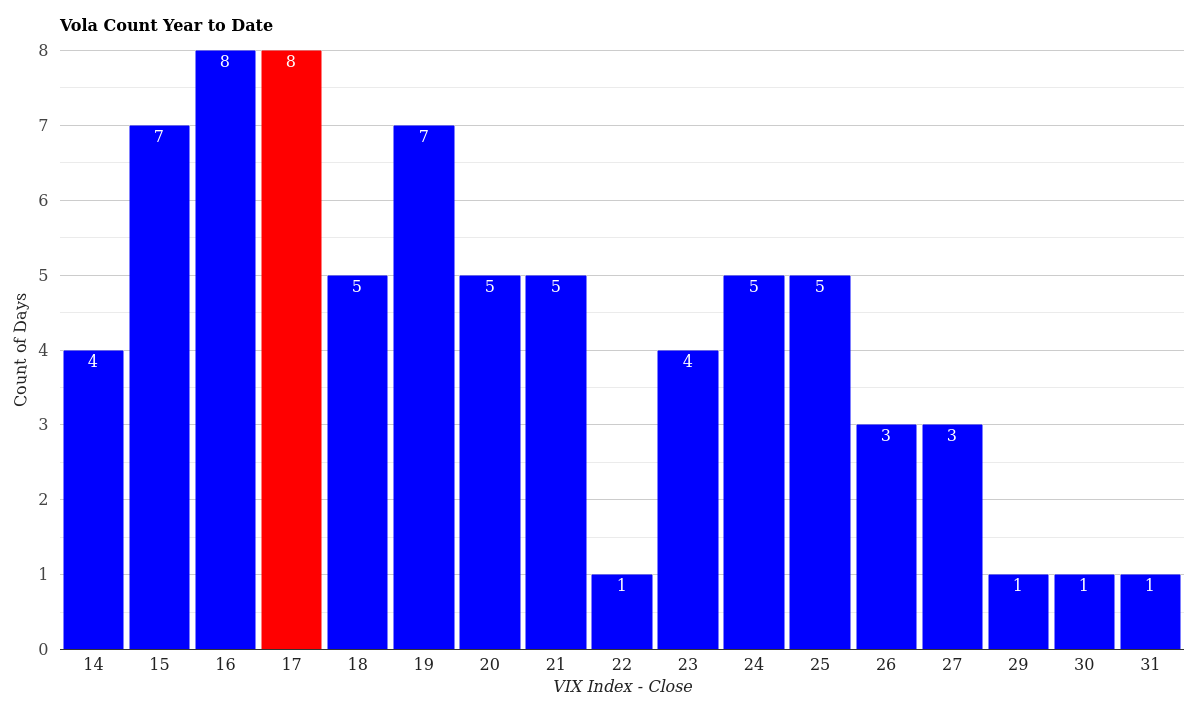
VIX Volatility Distribution – Year to Date
What This Means for Traders Right Now
Today’s setup presents a textbook “low volatility, carry-friendly” environment. Long equity positions face minimal daily swings, but that same calm reduces options premiums and makes defensive hedging cheap. Here’s what traders should consider:
For Long Stock Positions: Sleep well tonight. With VIX below 18 and the term structure in normal contango, the market is pricing in stability. However, don’t become complacent-contango structures can shift rapidly if headlines turn negative. The one-year contract sitting at 23.66 reminds us that deeper uncertainty persists beyond the next few weeks.
For Options Traders: Implied volatility is compressed, which crushes short-premium strategies (credit spreads, iron condors) and rewards long-premium positions for directional bets. If you’re a seller, require wider risk-reward ratios than usual; if you’re a buyer, near-term call spreads and put spreads offer better risk definitions than naked long options.
For Risk Managers: This is peak hedging opportunity. At 17.48, protective puts cost a fraction of what they would during the mid-March peak above 30. Forward hedging portfolios for summer and fall turbulence now while options are relatively cheap.
Key Levels to Watch: If the VIX breaks above 19.46 (the two-year mean), it signals a material shift in market psychology. Sustained movement above 20 would warrant caution. Conversely, if it drops below 15, complacency risk climbs-don’t expect that to last long in a world of persistent geopolitical tensions and earnings uncertainty.
Conclusion & Market Outlook
The VIX at 17.48 tells a simple story: markets are catching their breath after a volatile spring. The drop of 8.58% over five days, combined with a normal contango term structure and sub-mean readings, all point to reduced near-term fear. This is the environment where disciplined traders accumulate positions and risk managers lock in cheap hedges.
Yet complacency here would be dangerous. March’s spike above 45 left a fresh scar on the market’s psyche, and the one-year contract’s 23.66 level reminds us that traders aren’t forgetting about tail risks. Earnings season, Federal Reserve messaging, and any geopolitical flare-ups could reignite volatility faster than the charts currently suggest.
Monitor the 19.46 mean level closely-that’s the critical threshold. As long as the VIX trades below it, the narrative remains “market healing.” A breach above it would signal that the recent calm is over and fear is returning. Browse our daily VIX reports for historical volatility context and ongoing analysis.
For more market analysis visit stockbotty.com | Disclaimer
—