
A Macro Analysis of the Equity-Gold Correlation
The Illusion of Nominal Growth
In contemporary finance, the S&P 500 is often treated as the ultimate yardstick of economic
prosperity. When the index hits new highs, the narrative follows: corporate innovation is thriving,
productivity is soaring, and the economy is robust. However, this perspective relies on an
assumption that the dollar, the denominator of these valuations, is a static measure of value.
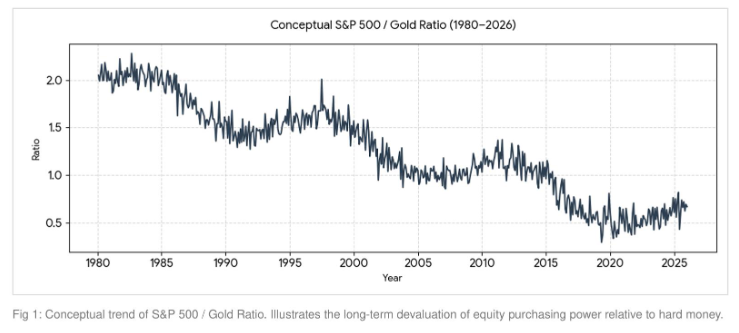
When we reframe the S&P 500 not in dollars, but in gold, the narrative changes significantly. The
accompanying chart illustrates a decades long erosion in the purchasing power of the equity
index relative to gold. This suggests that for the past several decades, the growth we have
observed in equities is largely an artifact of monetary debasement rather than organic
productivity gains.
The Fallacy of High Valuations
In financial media, an all time high Price to Earnings ratio is often cited as proof that the market is
expensive. However, this interpretation is flawed because it assumes a static monetary
environment. In a regime of constant monetary expansion, a high Price to Earnings ratio does not
signal overvaluation. Instead, it signals the liquidity premium that has been injected into the
entire system.
When central banks expand the money supply, that liquidity inevitably flows into financial assets.
Because the index is the primary vehicle for this capital, the price component of the valuation
equation rises. If earnings do not rise at the same speed, the ratio expands. Investors perceive
this as expensive, but they are simply paying for the liquidity premium that has been injected into
the plumbing of the financial system. Comparing current ratios to those of the mid twentieth
century is a logical error because the monetary regimes are fundamentally different.
The M2 Architect
If EPS growth were the primary engine of market valuation, we would expect equities to
consistently outperform hard assets regardless of the monetary environment. Instead, we see
that the most significant surges in equity prices correlate closely with expansions in M2 money
supply.
The argument here is structural: At the index level, equity valuation is a derivative of global
liquidity. When central banks expand the money supply, the tide rises, lifting all asset prices. This
results in P/E expansion, not because companies are fundamentally more valuable, but because
the currency used to price them is becoming more abundant.
The Phenomenon of Inflationary Earnings
We must distinguish between genuine productivity and inflationary earnings. Consider a
corporation that sells one hundred widgets at one dollar each. It generates one hundred dollars
in revenue. If it becomes more efficient, it sells one hundred and ten widgets at one dollar each.
This is genuine growth.
Now consider an inflationary environment. The company sells the same one hundred widgets,
but because the currency has been devalued, it charges one dollar and ten cents per widget to
maintain its margins. It reports one hundred and ten dollars in revenue. This looks like ten percent
growth on the income statement. However, the company is still producing and selling the exact
same amount of product. The growth is not operational. It is nominal. When we look at the S&P
500 through this lens, a significant portion of the earnings growth over the last forty years is simply
corporate entities passing along the cost of inflation to the consumer.
Micro Drivers versus Macro Liquidity
A critical distinction must be drawn between the index, the Macro, and individual stocks, the
Micro. While M2 creates the environment for index wide Beta performance, EPS growth remains
the critical Alpha driver for individual securities.
This dichotomy explains why individual companies, those that innovate, gain market share, and
optimize operations, can decouple from the broader liquidity trend. However, investors betting
on the broader index based on the hope of P/E expansion are often merely betting on continued
monetary policy accommodation.
Case Study: Identifying Inflationary Growth
To prove this concept, look at mature consumer staples companies like Coca Cola. These firms
are excellent examples for identifying the difference between price driven growth and volume
driven growth. In their quarterly earnings reports, management often breaks down organic
revenue growth into two categories: Price and Mix versus Volume.
If you look at the last decade of their filings, you will frequently see periods where revenue grows
by five percent, but volume growth is near zero or even negative. This is the smoking gun of
inflationary earnings. The company is not selling more product. They are simply charging higher
prices to offset the declining purchasing power of the dollar. To spot this in other companies, you
should compare revenue growth to unit volume growth. If revenue is rising while unit volume is
flat or declining, you are witnessing the passage of inflation through the income statement rather
than the creation of new wealth.
Conclusion: The Hard Asset Reality
Pricing equities in gold strips away the inflationary veneer of fiat currency. It reveals that much of
the equity market appreciation since 1980 is, in fact, a reflection of the dollar’s declining utility as
a store of value. As we look to the future, the reliance on liquidity driven multiples presents a
fragility. If the monetary tap slows, the growth that market participants have become accustomed
to may evaporate. The true engine of wealth, which is real productivity, has been secondary to the
monetary flood for too long.