
Energy Surges While Tech Stumbles: ETF Momentum Shifts on April 08, 2026
Today’s momentum data reveals a market in transition, with energy leading the charge while most sectors struggle to find footing. Oil and commodities show pronounced strength alongside selective reversals across technology and financials, suggesting active sector rotation is underway. The data reflects trading activity from April 7, 2026, and paints a picture of cautious but directional market movement.
Energy dominates the broader narrative. Crude oil ETF USO commands attention with an exceptional momentum score of +555.90 over the last nine days, though yesterday’s session showed a modest pullback. This contrasts sharply with the technology sector, where weakness persists across most holdings. Meanwhile, scattered reversals in industrials, materials, and financials suggest traders may be reconsidering their positioning in beaten-down areas.
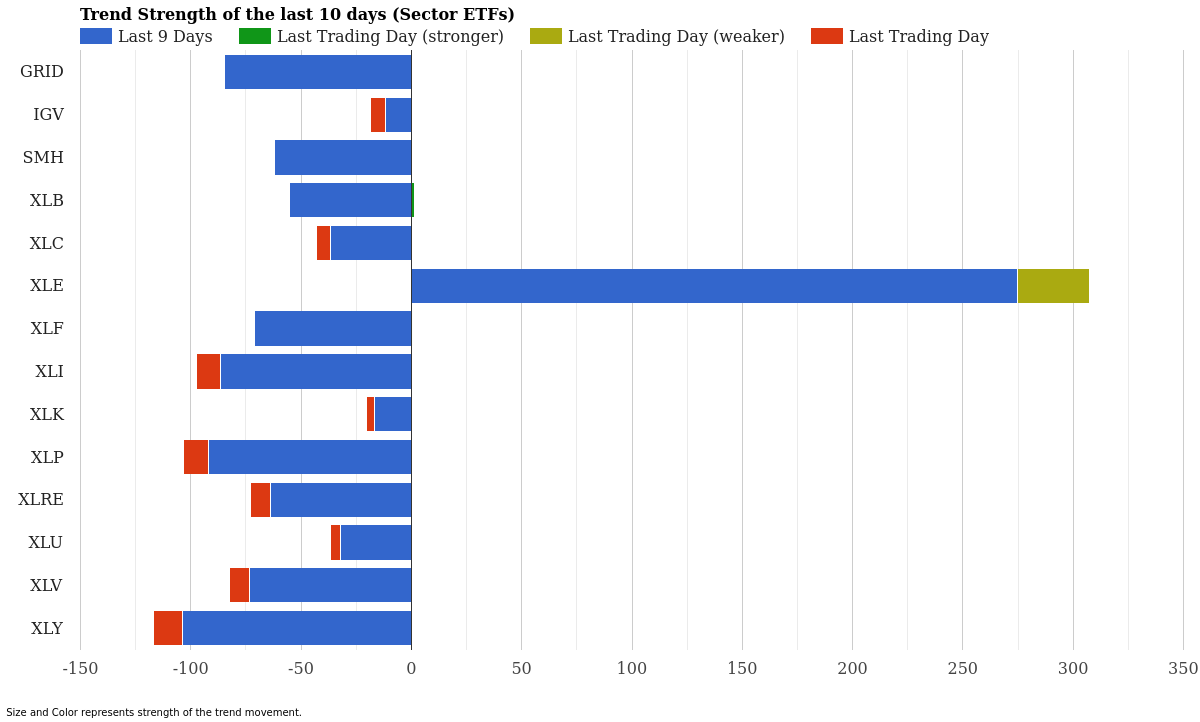
Sector ETF Trend Strength – Last 10 Days – April 08, 2026
Sector ETF Momentum Rankings
Energy stands alone at the top of the sector rankings, though the picture grows darker as you move down the list. Thirteen of fourteen sector ETFs show negative momentum over the nine-day window, indicating broad-based weakness that only energy escapes. The reversals appearing in XLB, SMH, XLF, and GRID hint at potential support levels being tested.
| Rank | ETF | Sector | 10-Day Strength | Today | Signal |
|---|---|---|---|---|---|
| 1 | XLE | Energy | +274.73 | -32.52 | Weakening |
| 2 | IGV | Software & IT | -11.61 | -6.72 | Downtrend |
| 3 | XLK | Technology | -16.75 | -3.75 | Downtrend |
| 4 | XLU | Utilities | -32.27 | -4.61 | Downtrend |
| 5 | XLC | Communications | -36.49 | -6.49 | Downtrend |
| 6 | XLB | Materials | -55.09 | +1.55 | Reversal |
| 7 | SMH | Semiconductors | -62.10 | +0.08 | Reversal |
| 8 | XLRE | Real Estate | -64.04 | -8.93 | Downtrend |
| 9 | XLF | Financials | -71.18 | +0.28 | Reversal |
| 10 | XLV | Healthcare | -73.19 | -9.47 | Downtrend |
| 11 | GRID | Grid Infrastructure | -84.68 | +0.07 | Reversal |
| 12 | XLI | Industrials | -86.54 | -11.05 | Downtrend |
| 13 | XLP | Consumer Staples | -91.79 | -11.64 | Downtrend |
| 14 | XLY | Consumer Discretionary | -103.72 | -13.25 | Downtrend |
Consumer discretionary (XLY) shows the weakest overall momentum with a score of -103.72, reflecting consumer caution that has persisted for over a week. Consumer staples (XLP) and industrials (XLI) follow closely behind, both entrenched in sustained downtrends. The tech sector’s mixed signals-with IGV and XLK both declining but SMH posting a reversal-suggest investors are selectively retreating from growth exposure.
The reversal signals in XLB, SMH, XLF, and GRID deserve attention. While these remain deeply negative on the nine-day view, yesterday’s positive momentum scores represent the first crack in their downtrend walls. Whether these are genuine bounces or false signals will become clearer over the next few sessions. Energy’s weakness despite its strong nine-day position indicates momentum may be fading even in the market’s strongest area.
Commodity ETF Momentum Rankings
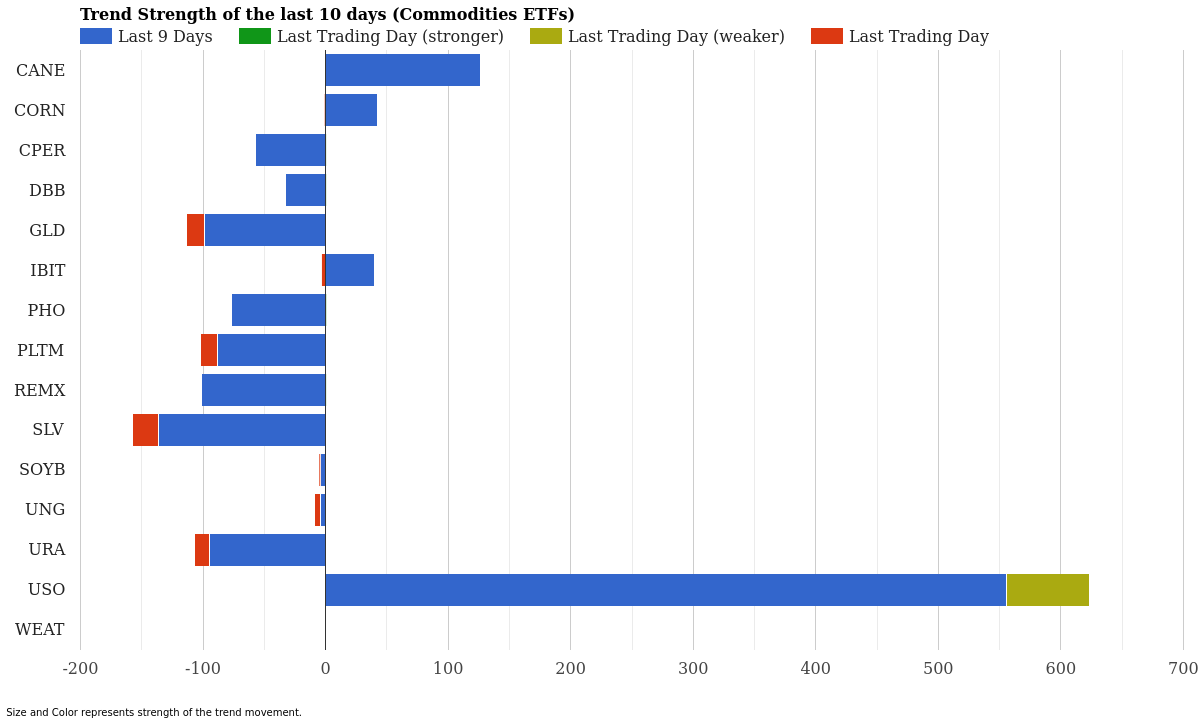
Commodity ETF Trend Strength – Last 10 Days – April 08, 2026
Commodities present a more complex picture than equities, with oil surging while precious metals and agricultural products languish. Crude oil (USO) leads by a massive margin with a momentum score of +555.90, though even this strength showed signs of cooling yesterday with a pullback of -67.00 points. Sugar (CANE) and corn (CORN) hold positive trends, while silver (SLV) and gold (GLD) continue their descent into significant weakness.
| Rank | ETF | Commodity | 10-Day Strength | Today | Signal |
|---|---|---|---|---|---|
| 1 | USO | Crude Oil | +555.90 | -67.00 | Weakening |
| 2 | CANE | Sugar | +126.54 | -0.13 | Slowing |
| 3 | CORN | Corn | +42.13 | -0.91 | Slowing |
| 4 | IBIT | Bitcoin | +39.96 | -3.74 | Slowing |
| 5 | WEAT | Wheat | -0.28 | -0.24 | Downtrend |
| 6 | UNG | Natural Gas | -4.28 | -4.67 | Downtrend |
| 7 | SOYB | Soybeans | -4.44 | -0.86 | Downtrend |
| 8 | DBB | Base Metals | -32.88 | +0.06 | Reversal |
| 9 | CPER | Copper | -57.51 | +0.00 | Reversal |
| 10 | PHO | Water | -77.17 | +0.33 | Reversal |
| 11 | PLTM | Platinum | -88.46 | -13.88 | Downtrend |
| 12 | URA | Uranium | -94.50 | -12.25 | Downtrend |
| 13 | GLD | Gold | -98.91 | -14.76 | Downtrend |
| 14 | REMX | Rare Earth Elements | -101.09 | +0.03 | Reversal |
| 15 | SLV | Silver | -136.63 | -20.79 | Downtrend |
Silver (SLV) represents the absolute worst performer in today’s report, with a catastrophic momentum score of -136.63 and accelerating weakness that saw a -20.79 drop yesterday. Gold (GLD) and uranium (URA) follow in the commodity basement, all pointing to a wholesale retreat from precious metals and industrial commodities. This contrasts sharply with oil’s dominance and suggests a flight away from traditional inflation hedges toward liquid energy plays.
The four reversals appearing in commodities-DBB, CPER, PHO, and REMX-offer the first signs of stabilization in brutally beaten-down sectors. Base metals (DBB) and copper (CPER) showed minimal positive movement yesterday, while rare earth (REMX) has collapsed -101.09 points. Like their sector counterparts, these reversals are too small to declare a turnaround, but they mark the first hesitation in months of declines.
Market Context and Interpretation
What we’re witnessing is a sharply divided market where energy and selective commodities are consolidating recent gains while nearly everything else deteriorates. This isn’t a recovery-it’s a rotation born from exhaustion. Oil’s extraordinary strength suggests geopolitical or supply concerns remain elevated, but the nine-day-to-one-day divergence (massive positive score followed by significant pullback) hints that even this rally may be losing steam.
Sector weakness tells a more concerning story. Consumer discretionary’s -103.72 score reflects genuine economic anxiety. When consumers aren’t buying, corporate earnings suffer. Technology’s mixed signals between softening in core holdings like XLK and isolated reversals in SMH suggest a market that hasn’t decided whether to embrace or abandon growth stocks. The financials reversal in XLF (up +0.28 yesterday) may indicate institutional buyers testing support, but we need more data to confirm conviction.
The precious metals collapse isn’t accidental. Gold and silver’s weakness despite economic uncertainty typically points to either deflation fears or a strengthening dollar scenario. That four commodities show minor reversals while the vast majority accelerate downward suggests market participants are repricing their entire view of risk and inflation. Real estate (XLRE), healthcare (XLV), and staples (XLP) all remain deeply negative, implying bond yields or other economic factors are pulling capital away from traditional defensive havens.
Key ETFs to Watch
The Three Strongest Across All Categories:
Oil stands apart with USO’s extraordinary momentum score of +555.90, though yesterday’s pullback demands scrutiny. Watch whether today’s session confirms strength or continues the retreat. CANE (sugar) and CORN follow as positive outliers, suggesting agricultural commodities may find support here. These three represent where real trading conviction exists at this moment.
Critical Reversals to Monitor:
Four sector reversals (XLB, SMH, XLF, GRID) and four commodity reversals (DBB, CPER, PHO, REMX) represent the market’s first signs of exhaustion selling. If these trend reversals hold and accelerate over the next few days, it would signal that we’re reaching inflection points in some of the most severely beaten-down areas. SMH’s reversal is particularly noteworthy given tech’s overall weakness-if semiconductors can stabilize, it might unlock broader tech recovery.
Highest Risk-Continued Deterioration:
Silver (SLV) with -136.63, consumer discretionary (XLY) with -103.72, and rare earth metals (REMX) with -101.09 show no signs of stopping. These three continue to shed momentum daily, indicating sellers remain in control. Any continued weakness in these could signal broader economic pessimism filtering into markets.
Conclusion
April 8, 2026 presents a market split between energy strength and broad-based weakness elsewhere. Oil’s dominance masks underlying instability in consumer spending, technology, and precious metals, while early reversals across multiple sectors suggest some oversold conditions might be developing. The next critical observation will be whether these reversals gain conviction or fade back into downtrends.
For traders and investors, energy positioning deserves scrutiny-momentum this extreme often precedes pullbacks. Conversely, the selective reversals in tech, industrials, and metals warrant close watching as potential entry points if the market’s pessimism has finally reached capitulation. The broad negative momentum across 13 of 14 sectors and 11 of 15 commodities suggests the tide hasn’t turned yet, but the first cracks are appearing.
Disclaimer: This report is for informational and educational purposes only. The momentum scores presented are calculated technical indicators and are not predictions of future price movements or trading recommendations. Past momentum does not guarantee future results. StockBotty does not provide financial advice, and you should conduct your own research or consult with a qualified financial advisor before making investment decisions. Trading and investing carry substantial risk of loss. All examples are hypothetical. Please see our full disclaimer at stockbotty.com/disclaimer.
Author Disclosure: The author may hold or has held positions in ETF-related instruments directly or through derivative constructs at the time of publication. This is not a trading recommendation. ETF holdings and positions are subject to change, and readers should verify current disclosures and conduct independent analysis before trading.
For more market analysis visit stockbotty.com | Disclaimer: stockbotty.com/disclaimer
—
More Momentum & Strength Articles
SHLD, GDX Lead as Utilities Plunge – Momentum August 22
Cybersecurity Climbs as Utilities Fade - August 22, 2026 Executive Summary Sector momentum shows ...
Aug 22, 2026Financials Lead, Utilities Collapse – August 21, 2026
Financials Lead as Utilities Collapse - August 21, 2026 Executive Summary Capital is rotating har...
Aug 21, 2026Commodities Lead as Sectors Fade – Momentum Rankings August 20
Commodities Surge as Tech Retreats - August 20, 2026 Executive Summary Commodity ETFs are command...
Aug 20, 2026Financials Lead as Utilities Collapse – August 19, 2026
Financials Lead as Utilities Slide - August 19, 2026 Capital is flowing into established financia...
Aug 19, 2026Financials Lead, Biotech Flips – ETF Momentum August 18
Financials Lead as Biotech Stalls - August 18, 2026 Executive Summary XLF (Financials) dominates ...
Aug 18, 2026