
Energy Surges While Tech Crumbles: ETF Momentum Shifts March 26
Executive Summary
March 26, 2026 delivered a stark tale of sector rotation, with energy and commodities driving momentum while traditional tech and consumer sectors collapsed under selling pressure. Energy (XLE) dominated with an exceptional +237.94 momentum score over the past 9 days, though yesterday’s session showed weakness at -28.66. Meanwhile, oil futures (USO) maintained explosive upward momentum with a +438.23 strength score. The broader market picture reveals a significant rotation away from equities and toward raw materials, signaling investor concerns about inflation or supply disruptions. Twelve of fourteen sector ETFs are in downtrend territory, indicating risk-off sentiment across most traditional equity categories.
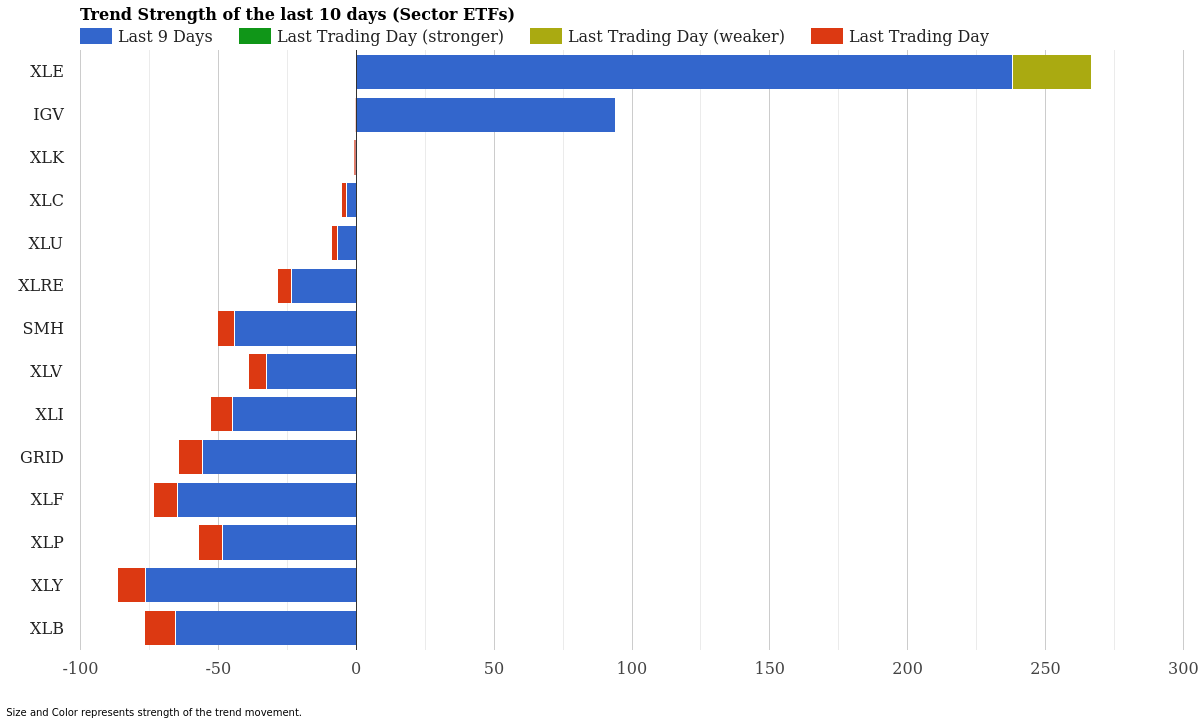
Sector ETF Trend Strength – Last 10 Days – March 26, 2026
Sector ETF Momentum Rankings
Energy stands virtually alone in positive territory, with all other major sectors showing weakness or deterioration. The distribution tells a concerning story: consumer discretionary (XLY) sits at the bottom with -76.36 momentum, joined by materials (XLB) at -65.73 and financials (XLF) at -64.97. This suggests money is rotating out of economically-sensitive sectors.
| Rank | ETF | 10-Day Strength | Yesterday | Signal |
|---|---|---|---|---|
| 1 | XLE – Energy | +237.94 | -28.66 | Weakening |
| 2 | IGV – Software | +93.87 | -0.22 | Slowing |
| 3 | XLK – Technology | -0.26 | -0.54 | Downtrend |
| 4 | XLC – Communication | -3.38 | -2.13 | Downtrend |
| 5 | XLU – Utilities | -6.69 | -2.42 | Downtrend |
| 6 | XLRE – Real Estate | -23.34 | -5.23 | Downtrend |
| 7 | XLV – Healthcare | -32.50 | -6.72 | Downtrend |
| 8 | SMH – Semiconductors | -44.04 | -6.12 | Downtrend |
| 9 | XLI – Industrials | -44.70 | -8.20 | Downtrend |
| 10 | XLP – Consumer Staples | -48.43 | -8.77 | Downtrend |
| 11 | GRID – Smart Grid | -55.86 | -8.47 | Downtrend |
| 12 | XLF – Financials | -64.97 | -8.56 | Downtrend |
| 13 | XLB – Materials | -65.73 | -11.18 | Downtrend |
| 14 | XLY – Consumer Discretionary | -76.36 | -10.32 | Downtrend |
Only two sectors maintain positive long-term momentum. XLE’s position is particularly interesting because while its 9-day strength score remains exceptionally strong, yesterday’s session delivered a sharp reversal downward. This pattern signals potential exhaustion in the energy rally, making it a critical ETF to monitor. IGV (software) shows minimal weakness with just -0.22 momentum yesterday, suggesting the tech sector may be stabilizing near support levels.
The losses accelerate as you move down the list. XLY (consumer discretionary) has deteriorated furthest, losing momentum over the past 9 days while consumer staples (XLP) and industrials (XLI) also show persistent selling pressure. This rotation away from growth and economically-sensitive sectors typically emerges when investors fear inflation or rising interest rates may constrain growth ahead.
Commodity ETF Momentum Rankings
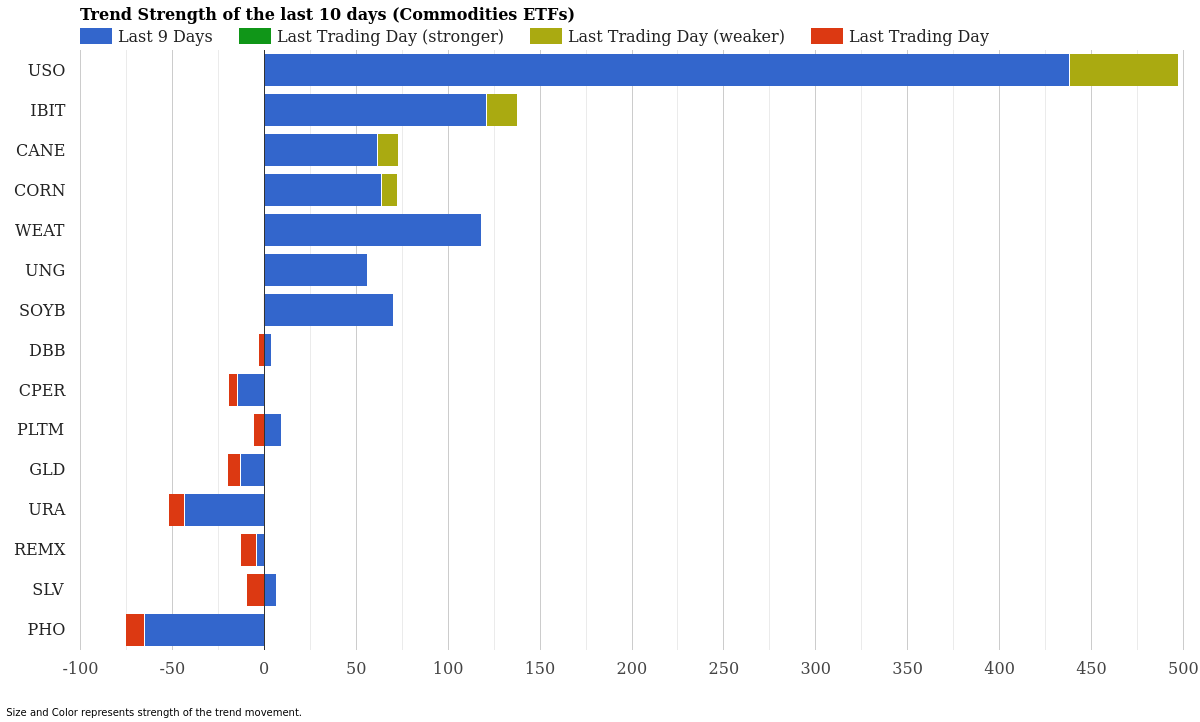
Commodity ETF Trend Strength – Last 10 Days – March 26, 2026
Commodities tell the inverse story from equities. While equity sectors crumble, raw materials and energy futures are capturing aggressive inflows. Ten of fifteen commodity ETFs maintain positive momentum scores, with USO leading at an extraordinary +438.23. Bitcoin (IBIT) follows with robust +121.08 momentum, suggesting dual inflation hedges are in strong demand.
| Rank | ETF | 10-Day Strength | Yesterday | Signal |
|---|---|---|---|---|
| 1 | USO – Oil Futures | +438.23 | -59.24 | Weakening |
| 2 | IBIT – Bitcoin | +121.08 | -16.86 | Weakening |
| 3 | WEAT – Wheat | +118.37 | -0.12 | Slowing |
| 4 | SOYB – Soybeans | +70.19 | -0.26 | Slowing |
| 5 | CORN – Corn | +63.97 | -8.52 | Weakening |
| 6 | CANE – Sugar | +61.56 | -11.45 | Weakening |
| 7 | UNG – Natural Gas | +56.39 | -0.12 | Slowing |
| 8 | PLTM – Platinum | +9.45 | -5.97 | Slowing |
| 9 | SLV – Silver | +6.56 | -9.96 | Slowing |
| 10 | DBB – Base Metals | +4.10 | -3.00 | Slowing |
| 11 | REMX – Rare Earth Metals | -4.44 | -8.79 | Downtrend |
| 12 | GLD – Gold | -12.73 | -7.16 | Downtrend |
| 13 | CPER – Copper | -14.44 | -4.94 | Downtrend |
| 14 | URA – Uranium | -43.67 | -8.64 | Downtrend |
| 15 | PHO – Water ETF | -65.03 | -10.39 | Downtrend |
What’s striking here is the divergence between trend strength and recent direction. Both USO and IBIT show exceptional 9-day momentum scores but suffered sharp reversals yesterday, displaying -59.24 and -16.86 scores respectively. These “weakening” signals deserve close attention-they suggest yesterday’s session may have cooled some of the speculative fervor in oil and crypto.
Agricultural commodities (WEAT, SOYB, CORN, CANE) occupy the middle tier with solid positive momentum but fading momentum contribution. WEAT maintains the strongest technical setup among them with minimal daily deterioration at -0.12. Meanwhile, the bottom of the commodity list tells its own story: uranium (URA) at -43.67 and water (PHO) at -65.03 are in full downtrends. This weakness in alternative energy plays contradicts the strength in oil, suggesting traders favor traditional energy over the transition narrative at present.
Market Context & Interpretation
We’re witnessing a textbook risk-off rotation playing out in real time. The sector weakness is unprecedented: twelve of fourteen major equity sectors are in downtrends. This severity suggests investors aren’t rotating between growth and value within equities-they’re rotating OUT of equities entirely.
Energy and commodities are capturing the capital flight. Oil’s explosive momentum indicates geopolitical concerns or supply disruptions may be pricing in. Bitcoin’s sustained strength-despite yesterday’s pullback-signals inflation concerns remain elevated. Investors are choosing hard assets over earnings-dependent equities.
The patterns emerging are classic inflationary positioning. When agriculture, energy, and crypto all lead together while tech and consumer discretionary collapse, it signals expectations of either higher prices, currency debasement, or both. The magnitude of XLY’s decline (-76.36) is particularly telling-consumer spending bets are being abandoned en masse.
Key ETFs to Watch
Top Momentum Leaders: USO continues to dominate with +438.23 strength despite yesterday’s pullback. XLE remains powerful at +237.94 despite weakening signals. IBIT’s +121.08 score keeps crypto in the conversation despite tech sector weakness.
Critical Reversals: USO and IBIT represent the most dangerous reversals. Both boasted explosive positive momentum that sharply contracted yesterday. If today’s session continues downward momentum, these could signal the top of the commodity rally. Watch for stabilization around yesterday’s lows as a potential reversal signal.
Persistent Weakness: XLY, XLB, and XLF remain in structural downtrends with no signs of capitulation. These sectors may need to fall further before establishing support. XLE is particularly dangerous-its weakening signal combined with strong 9-day positioning creates a potential trap for late buyers.
Conclusion
March 26’s momentum data reveals a market in transition. Equity sectors are being systematically abandoned while commodities and energy capture fresh capital. The reversal signals in USO and IBIT suggest the commodity rally may be encountering resistance after its powerful run. This is not a normal rotation-it’s a significant shift in market leadership with inflation protection assets displacing growth equities.
Traders monitoring trend strength should recognize that momentum scores this extreme create their own headwinds. When XLE’s 9-day score hits +237.94 but yesterday returned -28.66, it signals potential exhaustion rather than continuation. The same dynamic plays out in USO and IBIT. Monitor whether today’s session stabilizes these positions or accelerates the pullback. That answer will determine whether the commodity rally extends or rolls over into consolidation.
For more market analysis visit stockbotty.com | Disclaimer: stockbotty.com/disclaimer
—
More Momentum & Strength Articles
SHLD, GDX Lead as Utilities Plunge – Momentum August 22
Cybersecurity Climbs as Utilities Fade - August 22, 2026 Executive Summary Sector momentum shows ...
Aug 22, 2026Financials Lead, Utilities Collapse – August 21, 2026
Financials Lead as Utilities Collapse - August 21, 2026 Executive Summary Capital is rotating har...
Aug 21, 2026Commodities Lead as Sectors Fade – Momentum Rankings August 20
Commodities Surge as Tech Retreats - August 20, 2026 Executive Summary Commodity ETFs are command...
Aug 20, 2026Financials Lead as Utilities Collapse – August 19, 2026
Financials Lead as Utilities Slide - August 19, 2026 Capital is flowing into established financia...
Aug 19, 2026Financials Lead, Biotech Flips – ETF Momentum August 18
Financials Lead as Biotech Stalls - August 18, 2026 Executive Summary XLF (Financials) dominates ...
Aug 18, 2026