
Energy Surges While Sectors Crumble: March 25 Momentum Shift
Date: March 25, 2026
Markets painted a tale of two worlds on March 24’s session. Energy and select commodities staged a remarkable show of strength, while nearly every other sector stumbled under selling pressure. Of the 14 sector ETFs tracked, only 3 maintained positive momentum trends-a stark warning sign that sector rotation is accelerating away from traditional growth areas. Crude oil and agricultural futures led the charge, with USO commanding a stunning momentum score of +413.10 over the past nine days, even as yesterday’s session pulled back slightly. Meanwhile, consumer discretionary, financials, and industrial stocks bore the brunt of outflows, signaling a defensive shift in market psychology.
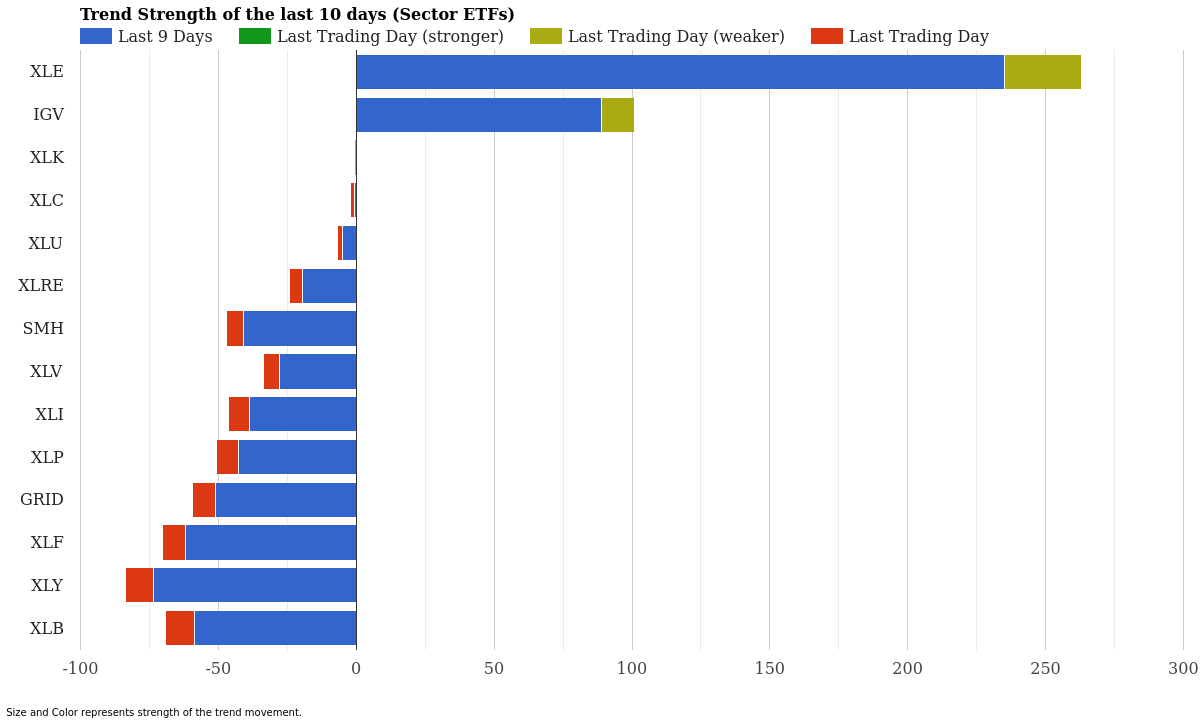
Sector ETF Trend Strength – Last 10 Days – March 25, 2026
Sector ETF Momentum Rankings
| Rank | ETF | 10-Day Strength | Last Trading Day | Signal |
|---|---|---|---|---|
| 1 | XLE | +234.99 | -28.10 | Weakening |
| 2 | IGV | +88.99 | -11.78 | Weakening |
| 3 | XLK | +0.15 | -0.38 | Slowing |
| 4 | XLC | -0.51 | -1.65 | Downtrend |
| 5 | XLU | -4.89 | -1.86 | Downtrend |
| 6 | XLRE | -19.55 | -4.49 | Downtrend |
| 7 | XLV | -27.69 | -6.04 | Downtrend |
| 8 | XLI | -38.72 | -7.66 | Downtrend |
| 9 | SMH | -41.04 | -6.04 | Downtrend |
| 10 | XLP | -42.83 | -8.01 | Downtrend |
| 11 | GRID | -51.20 | -8.14 | Downtrend |
| 12 | XLB | -58.60 | -10.53 | Downtrend |
| 13 | XLF | -61.82 | -8.40 | Downtrend |
| 14 | XLY | -73.61 | -9.95 | Downtrend |
Energy stands alone at the top, with XLE maintaining a formidable momentum score of +234.99 over the past nine days. However, the weakening signal flashing alongside this strength should not be overlooked-yesterday’s session delivered a negative momentum score of -28.10, suggesting the energy rally may be running out of steam. Software and cloud computing stocks, tracked by IGV, also hold positive longer-term momentum at +88.99, yet yesterday continued the pullback pattern with a momentum score of -11.78.
The reality becomes grimmer below these top two performers. Technology (XLK) is barely hanging on to positive ground with a momentum score of just +0.15 over nine days, while 11 out of 14 sectors are now in confirmed downtrends. Consumer discretionary (XLY) leads the losses with a -73.61 momentum score, followed by financials (XLF) at -61.82. Materials (XLB) and utilities (GRID) are also deep in negative territory. This broad sector weakness tells a story of capital rotation away from growth and into defensive havens-or out of equities entirely.
Commodity ETF Momentum Rankings
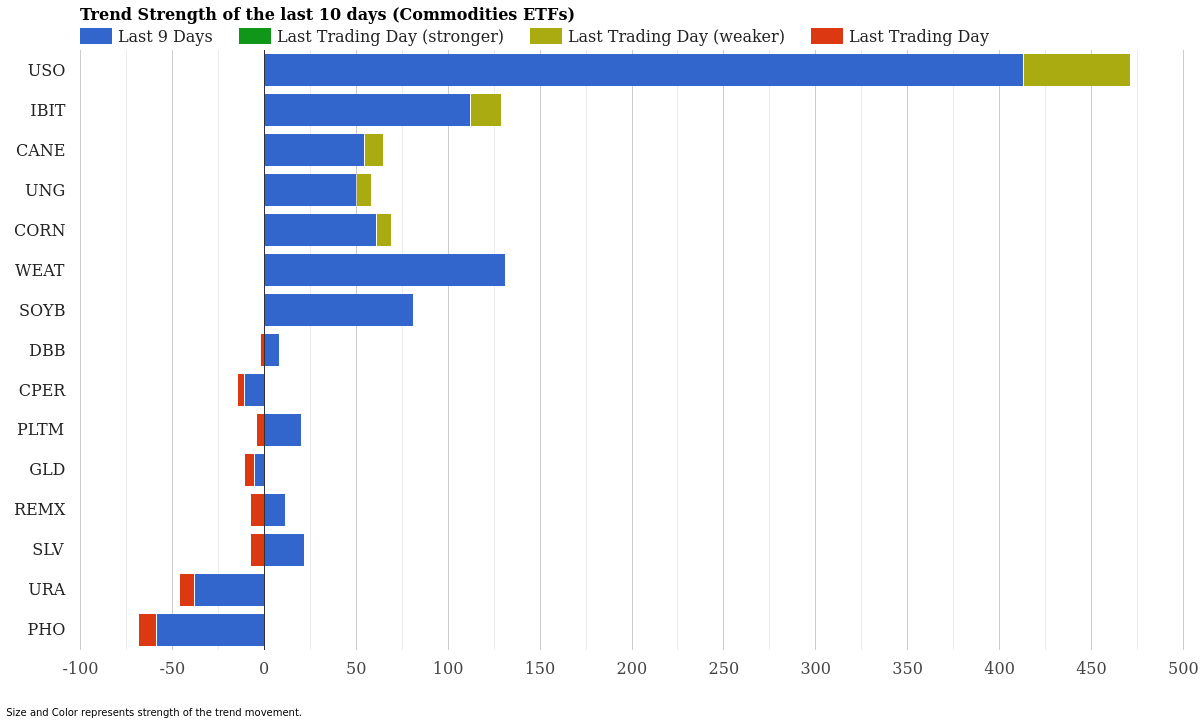
Commodity ETF Trend Strength – Last 10 Days – March 25, 2026
| Rank | ETF | 10-Day Strength | Last Trading Day | Signal |
|---|---|---|---|---|
| 1 | USO | +413.10 | -58.26 | Weakening |
| 2 | WEAT | +131.17 | -0.03 | Slowing |
| 3 | IBIT | +112.25 | -16.62 | Weakening |
| 4 | SOYB | +80.95 | -0.18 | Slowing |
| 5 | CORN | +60.75 | -8.32 | Weakening |
| 6 | CANE | +54.65 | -10.32 | Weakening |
| 7 | UNG | +50.12 | -8.37 | Weakening |
| 8 | SLV | +21.85 | -7.78 | Slowing |
| 9 | PLTM | +20.14 | -4.52 | Slowing |
| 10 | REMX | +11.30 | -7.35 | Slowing |
| 11 | DBB | +8.24 | -2.33 | Slowing |
| 12 | GLD | -5.27 | -5.54 | Downtrend |
| 13 | CPER | -10.68 | -4.13 | Downtrend |
| 14 | URA | -38.13 | -7.88 | Downtrend |
| 15 | PHO | -58.82 | -9.90 | Downtrend |
Crude oil dominates the commodity space. USO carries an extraordinary momentum score of +413.10-the strongest reading across all 29 tracked ETFs. This reflects crude’s remarkable rally over the past nine days, though yesterday’s pullback of -58.26 signals momentum may be peaking. Bitcoin (IBIT) ranks third with a solid +112.25 momentum score, maintaining its position as a risk asset favored during uncertain times.
Agriculture shows mixed signals. Wheat (WEAT) sits in the second spot with +131.17 momentum, barely moving yesterday as traders consolidate. Soybeans (SOYB) and corn (CORN) follow with positive longer-term strength but are showing weakening momentum on recent sessions. By contrast, precious metals face headwinds: gold (GLD) is in confirmed downtrend territory with -5.27, while uranium (URA) and water stocks (PHO) are deep underwater at -38.13 and -58.82 respectively.
Market Context and What This Tells Us
The divergence between energy/commodities and broad equities reveals a critical rotation story. Investors are rotating out of growth-dependent sectors-technology, consumer discretionary, financials-and into defensive positions or tangible assets like oil and agricultural products. This rotation typically occurs when economic uncertainty rises or inflation concerns dominate market thinking.
Energy’s strength is particularly telling. XLE‘s massive momentum score reflects genuine buying in energy stocks, likely driven by expectations of higher oil prices or sustained geopolitical tensions that support crude demand. Yet the weakening signal-where yesterday’s reading was significantly negative-suggests traders are taking profits or pausing their advance. This is a classic pattern: strong money has entered the position, but fresh momentum is not confirming the move higher.
The commodity complex as a whole leans bullish, with 11 of 15 ETFs holding positive nine-day momentum scores. The agricultural sector in particular shows sustained interest, with wheat and soybeans leading the charge. Bitcoin’s strength alongside energy and agriculture suggests speculators are hedging against inflation or currency debasement-a concerning signal that monetary authorities may be losing control of price pressures.
What concerns us most is the breadth of sector weakness. Having 11 out of 14 sector ETFs in downtrend territory is not a sign of normal market rotation-it’s a warning. When this many sectors are simultaneously weak, it often precedes a more significant pullback or suggests the rally that’s driven energy higher is coming from defensive positioning rather than broad economic optimism.
Key ETFs to Watch
The Strongest Performers Across All Asset Classes
USO (Crude Oil) remains the unquestioned momentum leader with a +413.10 score, but traders must watch for follow-through. The massive negative reading yesterday of -58.26 means selling pressure is real. A continuation of negative days would crack the narrative.
XLE (Energy Stocks) holds the second-strongest position in our combined rankings. The +234.99 score shows institutional commitment, yet the -28.10 reading yesterday mirrors USO’s pattern-early strength showing fatigue. Watch for whether the next few sessions deliver positive or negative momentum scores.
WEAT (Wheat Futures) deserves attention as a potential sleeper strength. Its +131.17 momentum score is nearly as impressive as crude, with much less volatility. The minimal pullback yesterday suggests wheat is building a sustainable base for further gains.
Critical Reversals to Monitor
Two reversal patterns demand attention. XLK (Technology) is barely holding positive territory with just +0.15. Any negative momentum reading in the next session will mark a technical break and could accelerate selling in the sector. Similarly, IBIT (Bitcoin) is weakening faster than the broader momentum score suggests-the -16.62 yesterday is sizeable relative to other assets and could signal broader risk-off sentiment emerging.
Sectors Showing Persistent Weakness
Avoid fighting the downtrends. XLY (Consumer Discretionary) at -73.61 and XLF (Financials) at -61.82 are in deep negative territory with no near-term relief visible. GRID (Clean Energy) at -51.20 is particularly concerning given the broader energy strength-this suggests clean energy is losing the narrative race to traditional fossil fuels, at least in the minds of current market participants.
Conclusion
March 24 painted a portrait of a market in transition. Energy and commodities are rallying sharply on either inflation concerns or geopolitical risk, while the vast majority of equity sectors are retreating. This is not a healthy, broad-based advance. Rather, it’s a tactical rotation driven by fear or inflation hedging. The weakening signals flashing on USO, XLE, and IBIT-our three strongest performers-suggest this energy-driven momentum run may be encountering resistance. Traders should watch the next few sessions closely. If energy momentum continues to deteriorate while sectors remain weak, the selloff could accelerate meaningfully. Conversely, if energy finds buyers again and momentum rebounds, the story shifts to genuine inflation repricing, which would have major implications for interest rates and asset valuations.
For now, the data screams caution. Strength this narrow rarely leads anywhere good.
For more market analysis visit stockbotty.com | Disclaimer: stockbotty.com/disclaimer
—
More Momentum & Strength Articles
SHLD, GDX Lead as Utilities Plunge – Momentum August 22
Cybersecurity Climbs as Utilities Fade - August 22, 2026 Executive Summary Sector momentum shows ...
Aug 22, 2026Financials Lead, Utilities Collapse – August 21, 2026
Financials Lead as Utilities Collapse - August 21, 2026 Executive Summary Capital is rotating har...
Aug 21, 2026Commodities Lead as Sectors Fade – Momentum Rankings August 20
Commodities Surge as Tech Retreats - August 20, 2026 Executive Summary Commodity ETFs are command...
Aug 20, 2026Financials Lead as Utilities Collapse – August 19, 2026
Financials Lead as Utilities Slide - August 19, 2026 Capital is flowing into established financia...
Aug 19, 2026Financials Lead, Biotech Flips – ETF Momentum August 18
Financials Lead as Biotech Stalls - August 18, 2026 Executive Summary XLF (Financials) dominates ...
Aug 18, 2026