
ETF Momentum Report – March 20, 2026: Energy Surge Fades as Sectors Face Broad Weakness
Executive Summary
March 20, 2026 presents a market tale of two distinct momentum regimes. While commodities continue to dominate with 12 out of 15 ETFs showing positive nine-day momentum, the picture inverts dramatically in the equity sector space, where 10 of 14 sector ETFs display negative momentum. Energy (XLE) and software (IGV) lead the commodity-driven rally, yet both show critical weakening signals as today’s trading reversed yesterday’s gains. The broader equity sectors tell a concerning story: consumer discretionary (XLY), financials (XLF), and materials (XLB) face sustained downward pressure, suggesting rotation away from economically sensitive areas. All data reflects market activity from March 19, 2026.
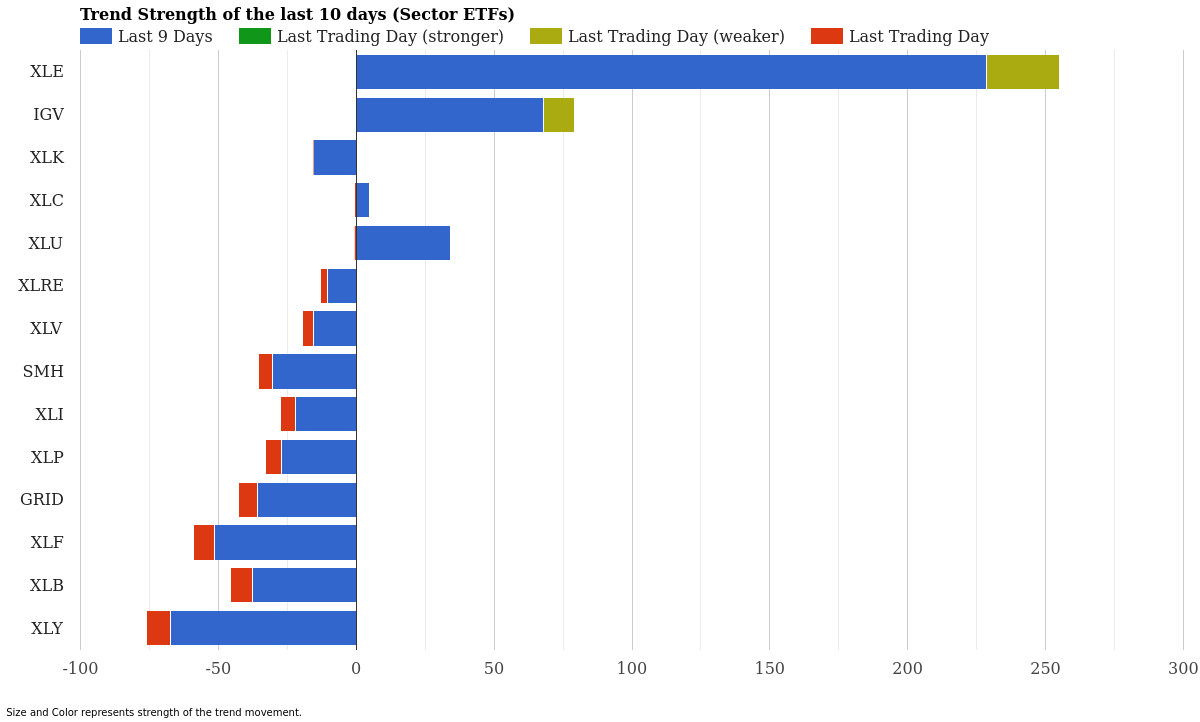
Sector ETF Trend Strength – Last 10 Days – March 20, 2026
Sector ETF Momentum Rankings
Energy and software technology represent the only bright spots in today’s sector landscape, though both display warning signals that merit close attention from active traders.
| Rank | ETF | 10-Day Strength | Today’s Signal | Status |
|---|---|---|---|---|
| 1 | XLE | +228.52 | -26.66 | Weakening |
| 2 | IGV | +67.77 | -11.28 | Weakening |
| 3 | XLU | +34.08 | -0.66 | Slowing |
| 4 | XLC | +4.78 | -0.51 | Slowing |
| 5 | XLRE | -10.29 | -2.82 | Downtrend |
| 6 | XLV | -15.45 | -4.00 | Downtrend |
| 7 | XLK | -15.64 | -0.02 | Downtrend |
| 8 | XLI | -21.93 | -5.64 | Downtrend |
| 9 | XLP | -27.15 | -5.84 | Downtrend |
| 10 | SMH | -30.35 | -5.24 | Downtrend |
| 11 | GRID | -35.94 | -6.69 | Downtrend |
| 12 | XLB | -37.53 | -7.97 | Downtrend |
| 13 | XLF | -51.52 | -7.65 | Downtrend |
| 14 | XLY | -67.31 | -8.65 | Downtrend |
The sector picture reveals a market in clear transition. Only energy and software maintain positive nine-day momentum scores, yet both display weakening signals that suggest their recent strength may be fading. The pair lost momentum today, with XLE dropping -26.66 points and IGV falling -11.28 points-a concerning reversal for the sector leaders.
Everything else faces headwinds. Consumer discretionary (XLY) sits at the bottom with a momentum score of -67.31, followed by financials (XLF) at -51.52 and materials (XLB) at -37.53. These three represent the most economically sensitive portions of the market, suggesting investors are rotating away from growth and cyclical exposure. Healthcare (XLV), semiconductors (SMH), and infrastructure (GRID) complete the weakness picture with downtrend signals across the board.
Commodity ETF Momentum Rankings
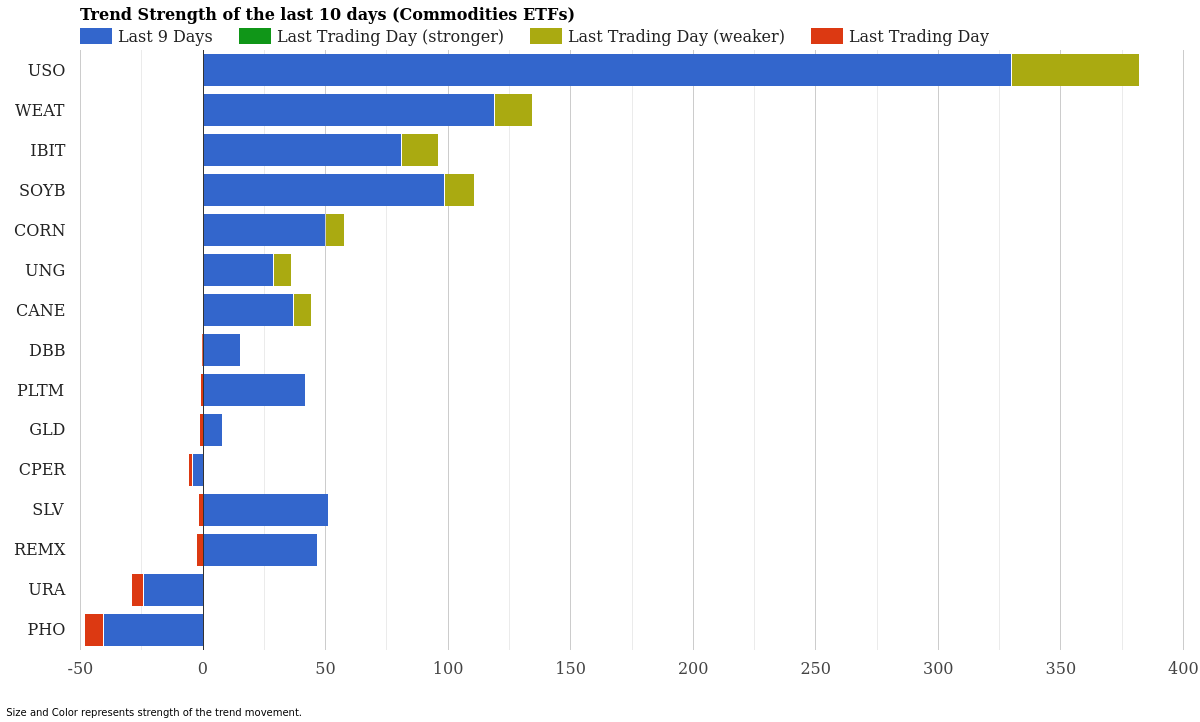
Commodity ETF Trend Strength – Last 10 Days – March 20, 2026
Commodities tell a dramatically different story. This sector showcases the strength that equities are missing, with oil, wheat, bitcoin, and soybeans leading a 12-strong positive momentum cohort. Yet here too, warning signs emerge as nearly all leaders display weakening momentum.
| Rank | ETF | 10-Day Strength | Today’s Signal | Status |
|---|---|---|---|---|
| 1 | USO | +329.70 | -52.40 | Weakening |
| 2 | WEAT | +118.96 | -15.37 | Weakening |
| 3 | SOYB | +98.67 | -12.13 | Weakening |
| 4 | IBIT | +80.92 | -15.03 | Weakening |
| 5 | SLV | +51.00 | -1.80 | Slowing |
| 6 | CORN | +50.07 | -7.49 | Weakening |
| 7 | REMX | +46.66 | -2.48 | Slowing |
| 8 | PLTM | +41.99 | -0.93 | Slowing |
| 9 | CANE | +36.94 | -7.23 | Weakening |
| 10 | UNG | +28.91 | -7.29 | Weakening |
| 11 | DBB | +15.29 | -0.42 | Slowing |
| 12 | GLD | +8.02 | -1.50 | Slowing |
| 13 | CPER | -4.27 | -1.58 | Downtrend |
| 14 | URA | -24.12 | -5.14 | Downtrend |
| 15 | PHO | -40.45 | -7.96 | Downtrend |
USO leads all commodities with a momentum score of +329.70-the single strongest momentum reading across both sectors. Wheat (WEAT), soybeans (SOYB), and bitcoin (IBIT) follow with respective scores of +118.96, +98.67, and +80.92. This commodity leadership reflects elevated geopolitical tensions and inflation concerns driving energy and agricultural prices.
However, the momentum fade signals caution. All four market leaders display weakening signals, suggesting today’s selling pressure may accelerate if these trends break. Silver (SLV), rare earth metals (REMX), platinum (PLTM), and base metals (DBB) show slightly more stability with slowing signals-indicating their nine-day momentum remains intact but without today’s aggressive selling pressure. Water stocks (PHO), uranium (URA), and copper (CPER) remain trapped in downtrends with no relief in sight.
Market Context and Interpretation
This dual-regime momentum landscape paints a picture of market confusion and sector rotation in action. Equities are experiencing broad weakness, particularly in growth and cyclical segments. Investors appear to be de-risking from consumer discretionary names and technology leaders while simultaneously avoiding traditional defensive sectors like utilities and staples. This pattern doesn’t match typical risk-off behavior-instead, it suggests flight to commodities as markets price in inflation or supply-chain concerns.
The commodity strength, especially in energy, reflects real-world economic signals. Oil, wheat, and agricultural products tend to rise when global supply tightens or geopolitical risks elevate. Bitcoin’s inclusion in the commodity rally suggests some flight to alternative stores of value. Yet the magnitude of the momentum fade in today’s session raises a yellow flag: markets may be overextended on the commodity side.
One critical observation: the equity market isn’t rallying broadly, nor is it selling off uniformly. Financials and consumer discretionary are hurting while healthcare and technology maintain relative weakness. This isn’t a traditional correction where everything falls together. Instead, it reflects a reshuffling of sector exposure with money rotating into energy and commodities rather than equities broadly.
Key ETFs to Watch
The Three Strongest Performers: USO, WEAT, and XLE represent the current momentum leaders across all sectors. USO’s +329.70 momentum score dwarfs all others, making it the single most powerful trend in today’s data. However, the -52.40 point drop today demands vigilance-this level of momentum can reverse quickly.
Critical Trend Reversals: XLE and IGV deserve close monitoring. Both exited their nine-day uptrends with significant momentum drops today. XLE’s -26.66 point reversal is especially notable given its leadership position. If energy momentum continues deteriorating, the entire commodity rally could unwind.
Most Fragile Names: XLY, XLF, and XLB face the steepest headwinds. Consumer discretionary’s -67.31 nine-day momentum score and -8.65 today signal sustained weakness. Without reversal signals, these sectors risk extending losses. Financials and materials offer similar concerns with no stabilization evident.
Conclusion
March 20, 2026 represents a market dominated by commodity strength and equity weakness. Twelve of fifteen commodity ETFs show positive momentum while only four of fourteen equity sectors do. Oil, wheat, and bitcoin lead an inflation-hedging regime that appears to be accelerating-yet today’s broad weakening across all four commodity leaders suggests the rally may be reaching exhaustion.
For traders, the takeaway is clear: momentum exists in commodities, but reversals are brewing. XLE and IGV’s weakening signals coupled with USO’s massive single-day momentum decline suggest caution before adding commodity exposure. On the equity side, cyclical sectors remain under pressure with no near-term stabilization visible. Until sector rotation signals a return to growth or cyclical names, defensive positioning appears warranted.
Monitor USO, XLE, and XLY closely. Any stabilization in energy momentum could reignite the commodity rally. Conversely, if today’s weakness extends, expect accelerated unwinds across the board.
Disclaimer: This report is for informational purposes only and should not be considered as financial advice. The data represents momentum scores calculated from historical price data; such scores do not guarantee future performance or returns. All investments carry risk, including potential loss of principal. Past momentum does not indicate future results. Sector and commodity trends can reverse rapidly without warning. Before making investment decisions, consult with a qualified financial advisor and conduct your own research. StockBotty.com and its authors accept no liability for trading losses or investment decisions based on this analysis.
Author Disclosure: The author may hold or has held positions in ETF-related instruments directly or through derivative constructs at the time of publication. This analysis reflects data-driven momentum assessment only and is not a trading recommendation. Readers should verify all data independently and assess their own risk tolerance before trading. All statements are based on the momentum data provided and represent objective analysis of that data only.
For more market analysis visit stockbotty.com | Disclaimer
—
More Momentum & Strength Articles
SHLD, GDX Lead as Utilities Plunge – Momentum August 22
Cybersecurity Climbs as Utilities Fade - August 22, 2026 Executive Summary Sector momentum shows ...
Aug 22, 2026Financials Lead, Utilities Collapse – August 21, 2026
Financials Lead as Utilities Collapse - August 21, 2026 Executive Summary Capital is rotating har...
Aug 21, 2026Commodities Lead as Sectors Fade – Momentum Rankings August 20
Commodities Surge as Tech Retreats - August 20, 2026 Executive Summary Commodity ETFs are command...
Aug 20, 2026Financials Lead as Utilities Collapse – August 19, 2026
Financials Lead as Utilities Slide - August 19, 2026 Capital is flowing into established financia...
Aug 19, 2026Financials Lead, Biotech Flips – ETF Momentum August 18
Financials Lead as Biotech Stalls - August 18, 2026 Executive Summary XLF (Financials) dominates ...
Aug 18, 2026