
ETF Momentum Report – March 19, 2026: Commodities Surge While Sectors Face Broad Headwinds
Executive Summary
The market displayed a stark divergence on March 18, 2026 (the most recent trading session reflected in today’s report), with commodity ETFs demonstrating robust 9-day momentum while sector equities faced significant selling pressure. Of 14 sector ETFs tracked, only 4 maintain positive 9-day trends, indicating a defensive rotation away from traditional equity sectors. Conversely, 12 of 15 commodity ETFs show strong positive momentum, led by energy (USO +301.21) and agricultural products (WEAT +114.02, SOYB +95.95). The Consumer Discretionary sector (XLY) experienced the steepest decline (-65.75 over 9 days, -8.31 today), while Technology showed the first meaningful reversal signal of the session. This bifurcated market structure suggests investors are rotating capital toward inflation hedges and away from growth and discretionary assets.
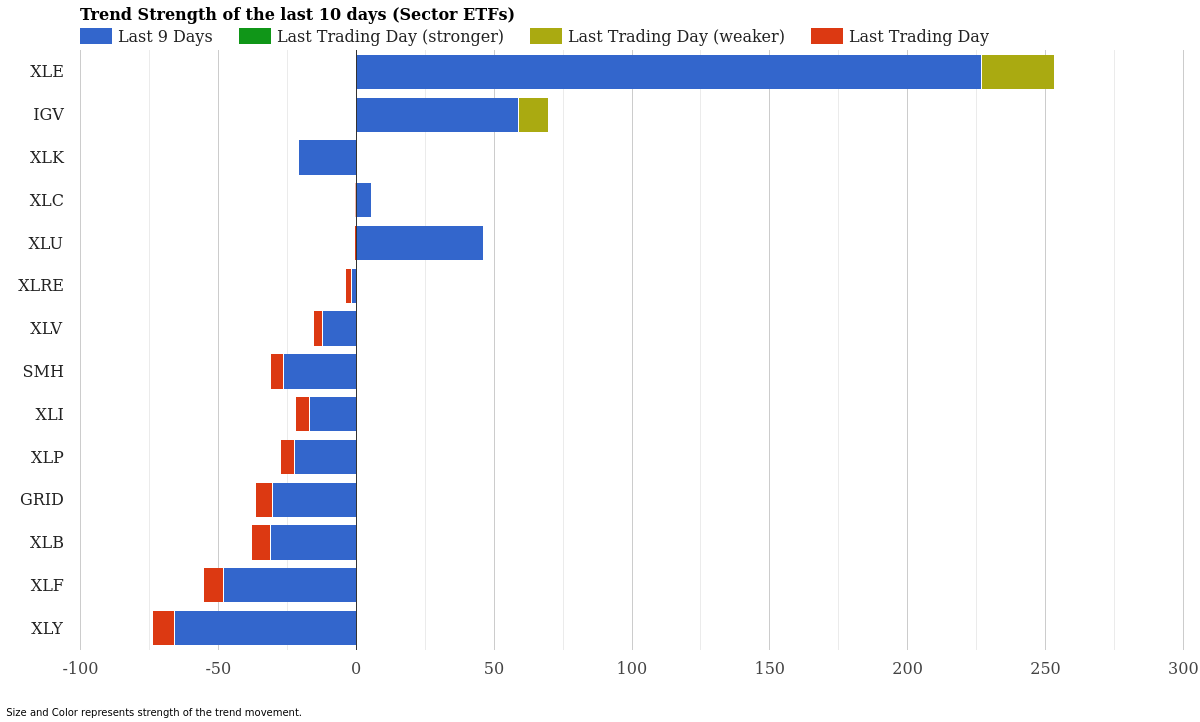
Sector ETF Trend Strength – Last 10 Days – March 19, 2026
Sector ETF Momentum Rankings
| Rank | ETF | 9-Day Strength | March 18 | Signal |
|---|---|---|---|---|
| 1 | XLE (Energy) | +226.80 | -26.25 | Weakening |
| 2 | IGV (Software) | +58.98 | -10.83 | Weakening |
| 3 | XLU (Utilities) | +46.32 | -0.54 | Slowing |
| 4 | XLC (Communications) | +5.59 | -0.28 | Slowing |
| 5 | XLRE (Real Estate) | -1.57 | -2.45 | Downtrend |
| 6 | XLV (Healthcare) | -12.08 | -3.43 | Downtrend |
| 7 | XLI (Industrials) | -17.05 | -4.95 | Downtrend |
| 8 | XLK (Technology) | -21.03 | +0.16 | Reversal |
| 9 | XLP (Consumer Staples) | -22.29 | -5.24 | Downtrend |
| 10 | SMH (Semiconductors) | -26.22 | -4.93 | Downtrend |
| 11 | GRID (Utilities Infrastructure) | -30.46 | -6.23 | Downtrend |
| 12 | XLB (Materials) | -30.93 | -7.18 | Downtrend |
| 13 | XLF (Financials) | -48.01 | -7.31 | Downtrend |
| 14 | XLY (Consumer Discretionary) | -65.75 | -8.31 | Downtrend |
Sector Analysis: The sector landscape on March 18 revealed severe downside pressure across a broad range of holdings. XLE and IGV, despite commanding the top two rankings with 9-day momentum of +226.80 and +58.98 respectively, both exhibited sharp weakening signals with single-day declines of -26.25 and -10.83. This suggests that extended energy and software rallies have exhausted near-term momentum. The most critical development is XLK’s reversal signal – after a 9-day downtrend of -21.03, Technology recorded a positive close (+0.16), potentially signaling stabilization in this crucial sector. However, the weakness is extensive: 10 of 14 sector ETFs displayed downtrend signals, with XLY suffering the worst performance (-65.75 over 9 days). This rotation away from discretionary and financial sectors indicates defensive positioning ahead of potential economic headwinds.
Commodity ETF Momentum Rankings
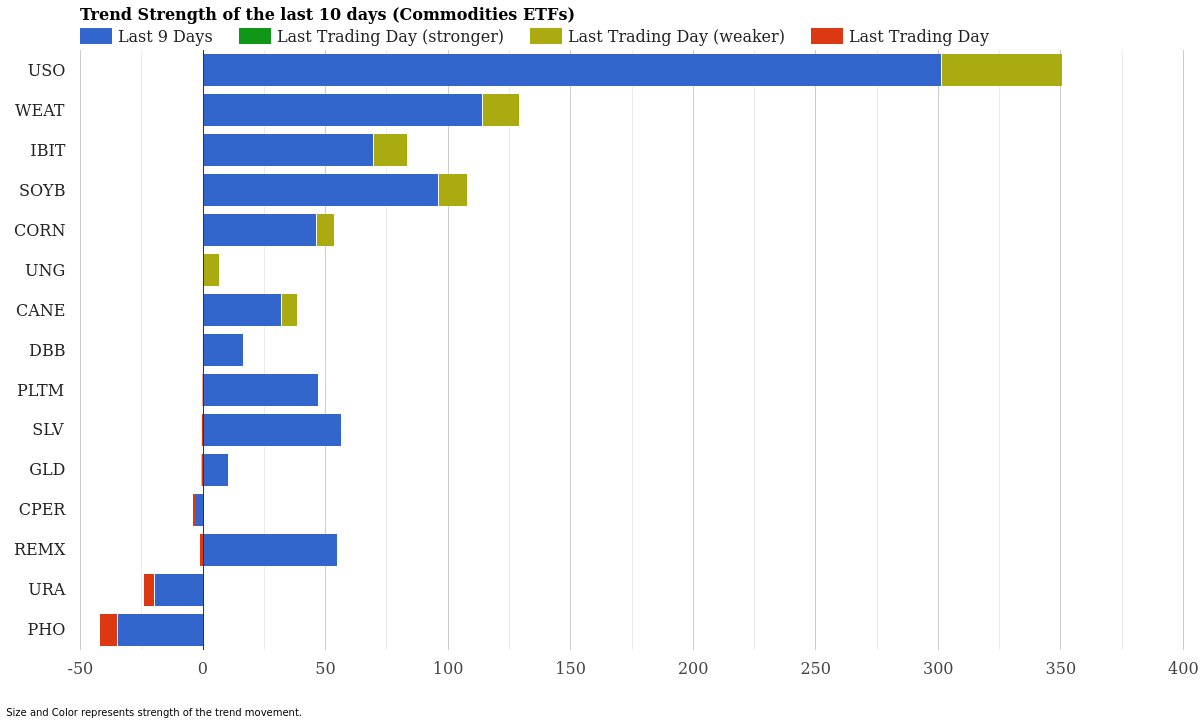
Commodity ETF Trend Strength – Last 10 Days – March 19, 2026
| Rank | ETF | 9-Day Strength | March 18 | Signal |
|---|---|---|---|---|
| 1 | USO (Oil & Gas) | +301.21 | -49.57 | Weakening |
| 2 | WEAT (Wheat) | +114.02 | -15.12 | Weakening |
| 3 | SOYB (Soybeans) | +95.95 | -12.09 | Weakening |
| 4 | IBIT (Bitcoin ETF) | +69.53 | -14.07 | Weakening |
| 5 | SLV (Silver) | +56.55 | -0.63 | Slowing |
| 6 | REMX (Rare Earth) | +54.90 | -1.34 | Slowing |
| 7 | PLTM (Platinum) | +46.92 | -0.27 | Slowing |
| 8 | CORN (Corn) | +46.35 | -7.16 | Weakening |
| 9 | CANE (Sugar) | +31.99 | -6.51 | Weakening |
| 10 | DBB (Base Metals) | +16.37 | -0.08 | Slowing |
| 11 | GLD (Gold) | +10.33 | -0.73 | Slowing |
| 12 | UNG (Natural Gas) | +0.23 | -6.53 | Weakening |
| 13 | CPER (Copper) | -3.29 | -1.02 | Downtrend |
| 14 | URA (Uranium) | -19.97 | -4.43 | Downtrend |
| 15 | PHO (Water) | -34.83 | -7.25 | Downtrend |
Commodity Analysis: The commodity complex presents a tale of two markets: strong 9-day momentum being met with significant profit-taking on March 18. USO’s extraordinary +301.21 strength score over nine days reflects sustained energy market strength, though the -49.57 single-day decline signals aggressive selling as prices potentially reached overbought conditions. Agricultural commodities (WEAT, SOYB, CORN, CANE) remain elevated due to ongoing supply concerns, yet all display weakening signals, indicating traders are locking in gains. Precious metals (SLV, GLD, PLTM) maintain slowing trajectories with modest downside, suggesting consolidation rather than reversal. Bitcoin-linked IBIT shows surprising strength (+69.53 over 9 days) but also significant daily weakness (-14.07), possibly reflecting institutional rebalancing. Only three commodities display outright downtrends: CPER (Copper at -3.29), URA (Uranium at -19.97), and PHO (Water at -34.83), with Water showing the most severe selling pressure, potentially indicating reduced demand expectations for resource-intensive infrastructure projects.
Market Context & Interpretation
The divergence between commodity strength and sector weakness on March 18, 2026 illustrates a classic risk-off rotation that accelerated at market close. Investors are systematically exiting growth and discretionary positions (XLY -8.31, SMH -4.93) while simultaneously bidding up inflation hedges. This behavior typically emerges when market participants anticipate either geopolitical disruptions (supporting energy), supply-chain disruptions (supporting agriculture), or monetary policy shifts that favor real assets over equities.
The energy complex’s extreme weakness on the day (-49.57 for USO) despite exceptional 9-day strength is particularly telling. Such violent single-day selloffs often occur when profit-takers exploit climactic rallies, suggesting energy may be vulnerable to further consolidation or pullback. The reversal in XLK, while subtle (+0.16), represents a critical turning point for the tech sector after nearly two weeks of decline. If confirmed over the coming sessions, this could signal that the heaviest technology selling has concluded.
The weakness in XLY (-65.75 cumulative, -8.31 today) and XLF (-48.01 cumulative, -7.31 today) indicates risk appetite is contracting markedly. These sectors typically lead during economic expansions; their deterioration suggests investors are bracing for slower growth or potential recessionary pressures. Conversely, the resilience of agricultural and precious metals suggests inflation remains a market concern despite sector equities declining – a pattern consistent with stagflationary expectations.
Key ETFs to Watch
1. USO (Oil & Gas) – The clear strength leader with +301.21 nine-day momentum, but the brutal -49.57 single-day decline raises questions about sustainability. Watch for consolidation in the $75-85 range. A break below recent support could trigger algorithmic selling. Monitor geopolitical headlines for catalysts.
2. XLK (Technology) – REVERSAL ALERT – After 9 consecutive down days (-21.03 total), Technology posted a positive close (+0.16) on March 18. This is the most significant technical signal of the day. If XLK can sustain gains into March 19-20, this could stabilize the entire sector complex and attract mean-reversion buying.
3. XLY (Consumer Discretionary) – The worst performer at -65.75 over nine days with accelerating daily weakness (-8.31). This sector’s collapse signals consumer confidence is deteriorating rapidly. Watch for capitulation below -70 on the 9-day strength score; historically, extreme readings often precede reversals.
Additional Watch List: WEAT and SOYB (agricultural weakness despite 9-day strength suggests profit-taking may be overdone), GLD and SLV (slowing signals in precious metals often precede secondary rallies), and IBIT (Bitcoin weakness alongside equity sector weakness may indicate deleveraging across asset classes).
Conclusion
March 18, 2026 presented a market in transition. The sharp commodity weakness despite exceptional 9-day momentum, combined with the broad-based equity sector decline and XLK’s potential reversal, suggests we are witnessing a corrective consolidation rather than a fundamental trend break. Investors rotated from growth into commodities and real assets earlier in the week, but profit-taking on March 18 indicates those trades have begun to exhaust themselves.
The most actionable signal is XLK’s reversal in Technology, which could stabilize sentiment across U.S. equities if momentum persists. Conversely, the extraordinary commodity weakness on the day (USO, WEAT, SOYB, CORN all declining despite strong fundamentals) suggests that inflation-sensitive trades may be due for consolidation. Traders should monitor whether energy and agricultural commodities find support around their 9-day moving averages, and whether XLK can build on its marginal gain into a sustained recovery. The Consumer Discretionary sector (XLY) represents the most acute weakness and bears continued scrutiny for signs of consumer spending deterioration.
For more market analysis, visit stockbotty.com | Full Disclaimer
—
More Momentum & Strength Articles
SHLD, GDX Lead as Utilities Plunge – Momentum August 22
Cybersecurity Climbs as Utilities Fade - August 22, 2026 Executive Summary Sector momentum shows ...
Aug 22, 2026Financials Lead, Utilities Collapse – August 21, 2026
Financials Lead as Utilities Collapse - August 21, 2026 Executive Summary Capital is rotating har...
Aug 21, 2026Commodities Lead as Sectors Fade – Momentum Rankings August 20
Commodities Surge as Tech Retreats - August 20, 2026 Executive Summary Commodity ETFs are command...
Aug 20, 2026Financials Lead as Utilities Collapse – August 19, 2026
Financials Lead as Utilities Slide - August 19, 2026 Capital is flowing into established financia...
Aug 19, 2026Financials Lead, Biotech Flips – ETF Momentum August 18
Financials Lead as Biotech Stalls - August 18, 2026 Executive Summary XLF (Financials) dominates ...
Aug 18, 2026