
ETF Momentum Report – March 18, 2026 (EOD Data): Energy Surges While Discretionary Plummets
Executive Summary
The market displayed a striking tale of two economies on March 17, 2026 (the previous trading day reflected in this End of Day report). While commodities-particularly energy and agriculture-maintained robust 9-day strength scores, sector equities told a more complicated story of momentum collision. Energy ETF (XLE) led all sectors with a commanding +225.15 strength score over the last 9 days, yet posted a sharp -25.90 weakness signal yesterday, signaling potential profit-taking after a powerful run. Consumer discretionary (XLY) continued its downward spiral at -64.34 over 9 days with an accelerating -8.06 daily decline, while financials (XLF) mirrored weakness at -44.59. The standout event: XLK (technology) triggered a rare reversal signal with a +0.12 move after 9 days in negative territory, suggesting a potential bottom-fishing opportunity. Overall, commodity strength remains the dominant theme, with 11 of 15 commodities ETFs in positive 9-day trends versus only 6 of 14 sector ETFs-a clear divergence indicating capital rotation into tangible assets amid macro uncertainty.
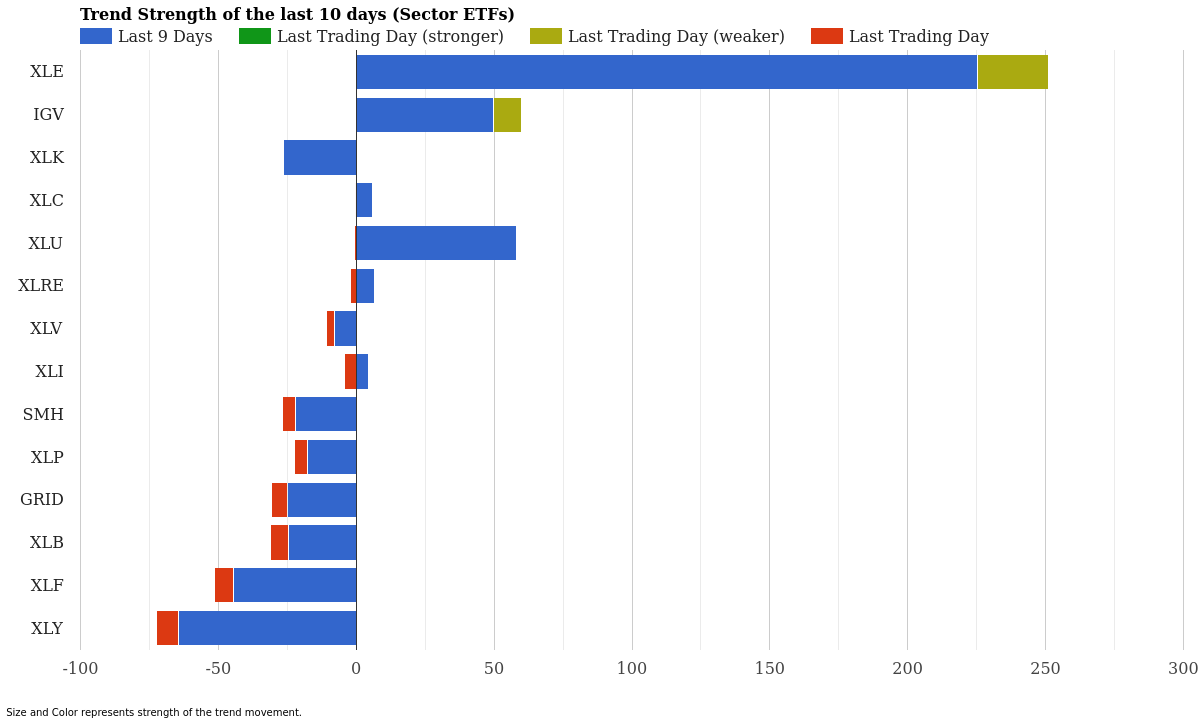
Sector ETF Trend Strength – Last 10 Days – March 18, 2026
Sector ETF Momentum Rankings
| Rank | ETF | Sector | 10-Day Strength | Yesterday EOD | Signal |
|---|---|---|---|---|---|
| 1 | XLE | Energy | +225.15 | -25.90 | Weakening |
| 2 | XLU | Utilities | +58.14 | -0.47 | Slowing |
| 3 | IGV | Software/Cloud | +49.80 | -10.25 | Weakening |
| 4 | XLRE | Real Estate | +6.76 | -2.13 | Slowing |
| 5 | XLC | Communication | +6.03 | -0.13 | Slowing |
| 6 | XLI | Industrials | +4.27 | -4.29 | Slowing |
| 7 | XLV | Healthcare | -7.73 | -2.92 | Downtrend |
| 8 | XLP | Consumer Staples | -17.69 | -4.70 | Downtrend |
| 9 | SMH | Semiconductors | -21.99 | -4.65 | Downtrend |
| 10 | XLB | Materials | -24.72 | -6.48 | Downtrend |
| 11 | GRID | Infrastructure | -25.00 | -5.78 | Downtrend |
| 12 | XLK | Technology | -26.31 | +0.12 | Reversal |
| 13 | XLF | Financials | -44.59 | -6.97 | Downtrend |
| 14 | XLY | Discretionary | -64.34 | -8.06 | Downtrend |
Sector Analysis: Energy led the sector pack by a wide margin, demonstrating the potency of the commodity super-cycle currently in motion. However, yesterday’s sharp -25.90 pullback in XLE suggests profit-taking among traders who rode the initial wave higher. The weakening signal requires monitoring to determine if this is consolidation or the start of a reversal. Software/Cloud (IGV) similarly showed strength over 9 days but cooled with a -10.25 decline, indicating volatility in growth-oriented technology. The bright spot: XLK triggered a critical reversal signal after nine straight days of losses, posting a small +0.12 gain. This technical reversal could signal capitulation selling has ended and represents a potential entry for mean-reversion traders. On the downside, consumer discretionary (XLY) remains the weakest sector at -64.34 cumulative strength with accelerating daily losses, reflecting consumer caution and recession-hedging rotation. Financials (XLF) also deteriorated sharply at -44.59, suggesting concerns about interest rates or credit market stress.
Commodity ETF Momentum Rankings
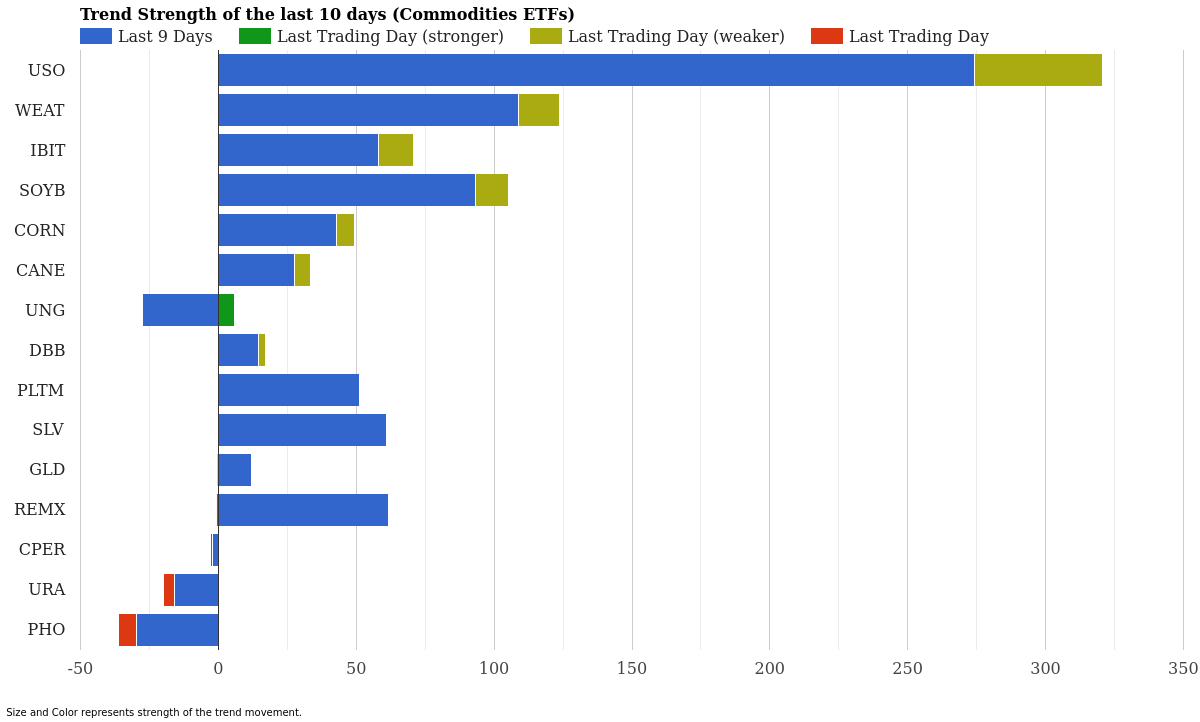
Commodity ETF Trend Strength – Last 10 Days – March 18, 2026
| Rank | ETF | Commodity | 10-Day Strength | Yesterday EOD | Signal |
|---|---|---|---|---|---|
| 1 | USO | Crude Oil | +274.04 | -46.49 | Weakening |
| 2 | WEAT | Wheat | +108.95 | -14.84 | Weakening |
| 3 | SOYB | Soybeans | +93.13 | -11.99 | Weakening |
| 4 | REMX | Rare Earth | +61.60 | -0.65 | Slowing |
| 5 | SLV | Silver | +60.88 | -0.11 | Slowing |
| 6 | IBIT | Bitcoin | +58.07 | -12.83 | Weakening |
| 7 | PLTM | Platinum | +51.07 | -0.02 | Slowing |
| 8 | CORN | Corn | +42.68 | -6.86 | Weakening |
| 9 | CANE | Sugar | +27.43 | -5.94 | Weakening |
| 10 | DBB | Precious Metals | +14.63 | -2.58 | Weakening |
| 11 | GLD | Gold | +12.06 | -0.33 | Slowing |
| 12 | CPER | Copper | -2.04 | -0.68 | Downtrend |
| 13 | URA | Uranium | -16.07 | -3.93 | Downtrend |
| 14 | UNG | Natural Gas | -27.39 | +5.80 | Reversal |
| 15 | PHO | Water | -29.69 | -6.56 | Downtrend |
Commodity Analysis: Commodities tell a far different story than equities. The table shows 11 of 15 commodity ETFs in positive 9-day trends versus only 6 of 14 sectors-a stark divergence that underscores the rally in hard assets. Crude oil (USO) dominates with an extraordinary +274.04 strength score, though like XLE, it posted a -46.49 pullback yesterday, suggesting traders are locking in gains after the surge. Agricultural commodities show broad strength: wheat (WEAT), soybeans (SOYB), and corn (CORN) all demonstrate positive 9-day trends despite weakness yesterday, pointing to structural supply concerns globally. Precious metals including silver (SLV) at +60.88 and rare earth elements (REMX) at +61.60 remain firmly in uptrends with minimal daily erosion, signaling conviction among value seekers. Bitcoin (IBIT) recorded +58.07 momentum but weakened yesterday with a -12.83 decline-volatility typical of digital assets during macro transitions. Most intriguingly, natural gas (UNG) triggered a reversal signal after nine consecutive losing days, posting a +5.80 reversal with a +5.80 gain. This could signal capitulation in the energy complex’ weakest link, potentially setting up contrarian traders. Water ETF (PHO) at -29.69 remains the commodity complex’s weakest performer, reflecting concerns about supply or infrastructure investment demand.
Market Context & Interpretation
The divergence between sector and commodity momentum is the defining story of this report. The commodity complex is dominating capital flows, with oil, agriculture, metals, and rare earths all demonstrating sustained strength over nine days. This rotation suggests macroeconomic concerns-stagflation fears, geopolitical disruption, or supply-chain anxiety-that send investors toward tangible assets as portfolio hedges. Energy and utilities remain the only sector ETFs with positive 9-day strength, while all others show weakness or downright deterioration.
Consumer discretionary’s collapse is particularly noteworthy. XLY’s -64.34 momentum and -8.06 daily decline point to either earnings disappointment, recession fears, or both. Companies selling high-margin goods face dual headwinds: inflation in input costs (commodity prices are up) and demand destruction as consumers retrench. This is classic risk-off behavior feeding the commodity rally.
Technology’s positioning is critical. XLK’s reversal signal-moving from -26.31 to +0.12-may signal exhaustion of selling. Tech selloffs often mark capitulation moments before rallies; the modest reversal suggests weak hands have exited and stronger hands are buying dips. Conversely, IGV’s -10.25 daily slide despite positive 9-day strength hints at continued volatility in growth equities, as investors remain torn between valuation relief and growth-to-value rotation.
Financials under pressure at -44.59 cumulative strength raises questions about credit cycles or rate expectations. If yields are rising (commodity inflation narrative), financial stocks should perform well. Their weakness suggests either recession fears (crushing loan demand) or margin compression from inverted yield curves. This warrants close monitoring of 10-year Treasury and bank equity spreads.
Key ETFs to Watch
Top 3 Strongest Across Both Groups:
- USO (Crude Oil) – +274.04 momentum. The dominant winner. Yesterday’s -46.49 weakness is normal consolidation after such a powerful run. Watch for a close above recent highs; a break confirms the uptrend; failure suggests profit-taking could accelerate.
- WEAT (Wheat) – +108.95 momentum. Geopolitical risks and harvest concerns keep wheat bid. The -14.84 daily decline is manageable; strength should persist into harvest season.
- XLE (Energy Equities) – +225.15 momentum. Energy stocks rode oil’s coattails higher. The -25.90 weakness needs to find support; if XLE holds above its 20-day moving average, the sector uptrend remains intact.
Critical Trend Reversals:
- XLK (Technology) – Breaking from -26.31 to +0.12 after 9 straight down days. This is a potential buy signal for mean reversion traders. Watch for a close above yesterday’s level to confirm; failure to hold +0.12 suggests sideways consolidation ahead.
- UNG (Natural Gas) – Breaking from -27.39 to +5.80. Natural gas has been battered by warm weather and supply. The reversal suggests cold-weather buying or production cuts. Contrarians should monitor; a sustained reversal could trigger short-covering.
Weakest with Continued Downside Risk:
- XLY (Consumer Discretionary) – -64.34 with accelerating -8.06 daily losses. This is the sector to avoid until reversal signals appear. Expect continued pressure as inflation squeezes consumer margins.
- PHO (Water ETF) – -29.69 momentum in negative territory. Thesis may have broken; wait for stabilization before considering entry.
- XLF (Financials) – -44.59 strength with -6.97 daily decline. Until credit spreads stabilize and equity volatility abates, financials face headwinds. A reversal here would signal broader risk appetite restoration.
Conclusion
The March 17 trading session (reported EOD March 18) crystallized a major market theme: assets over equities, commodities over discretionary. The commodity complex’s 11-of-15 positive 9-day record versus sectors’ 6-of-14 reflects capital rotation into tangible hedges. While energy’s sharp pull-back (XLE and USO) and technology’s reversal (XLK) suggest profit-taking and exhaustion respectively, the underlying trends remain intact. Investors should monitor XLK’s ability to hold above yesterday’s close and UNG’s reversal for sustainability. Consumer discretionary’s continued deterioration and financials’ weakness hint at either recession fears or structural margin pressures-both bearish until reversed. For traders, the divergence presents opportunities: long commodity momentum, short consumer discretionary weakness, and stay alert for tech’s mean reversion off near-term lows. The macro backdrop-inflation, geopolitical uncertainty, or demand destruction-will determine whether today’s themes persist through the remainder of Q1 2026.
DISCLAIMER: This report is for informational and educational purposes only. It does not constitute investment advice, a recommendation, or an offer to buy or sell any security. Past performance does not guarantee future results. All data is based on end-of-day closing prices from the previous trading session and may contain errors or delays. Market conditions change rapidly; momentum and strength scores can reverse without notice. Investors should conduct their own due diligence, consult a qualified financial advisor, and carefully consider their risk tolerance and investment objectives before making any trading decisions. StockBotty and its contributors assume no liability for losses incurred from reliance on this analysis.
AUTHOR DISCLOSURE: This report was generated using quantitative momentum analysis of publicly available ETF price data. No positions in the securities or ETFs mentioned are held by StockBotty staff at the time of publication. Analysis reflects market data only and should not be construed as an endorsement of any strategy or security. Readers should verify all data independently before acting.
For more market analysis visit stockbotty.com | Disclaimer: stockbotty.com/disclaimer
More Momentum & Strength Articles
SHLD, GDX Lead as Utilities Plunge – Momentum August 22
Cybersecurity Climbs as Utilities Fade - August 22, 2026 Executive Summary Sector momentum shows ...
Aug 22, 2026Financials Lead, Utilities Collapse – August 21, 2026
Financials Lead as Utilities Collapse - August 21, 2026 Executive Summary Capital is rotating har...
Aug 21, 2026Commodities Lead as Sectors Fade – Momentum Rankings August 20
Commodities Surge as Tech Retreats - August 20, 2026 Executive Summary Commodity ETFs are command...
Aug 20, 2026Financials Lead as Utilities Collapse – August 19, 2026
Financials Lead as Utilities Slide - August 19, 2026 Capital is flowing into established financia...
Aug 19, 2026Financials Lead, Biotech Flips – ETF Momentum August 18
Financials Lead as Biotech Stalls - August 18, 2026 Executive Summary XLF (Financials) dominates ...
Aug 18, 2026