
Energy Leads, Tech Lags: ETF Momentum Shifts on March 30, 2026
March 30, 2026 shows a market in transition. Energy commodities dominate with exceptional strength, while consumer discretionary and financials face persistent headwinds. The sector rotation reveals a flight toward defensive positioning and hard assets, even as technology infrastructure remains under pressure. Most of the 14 sector ETFs are in downtrends, signaling broad-based caution across equities.
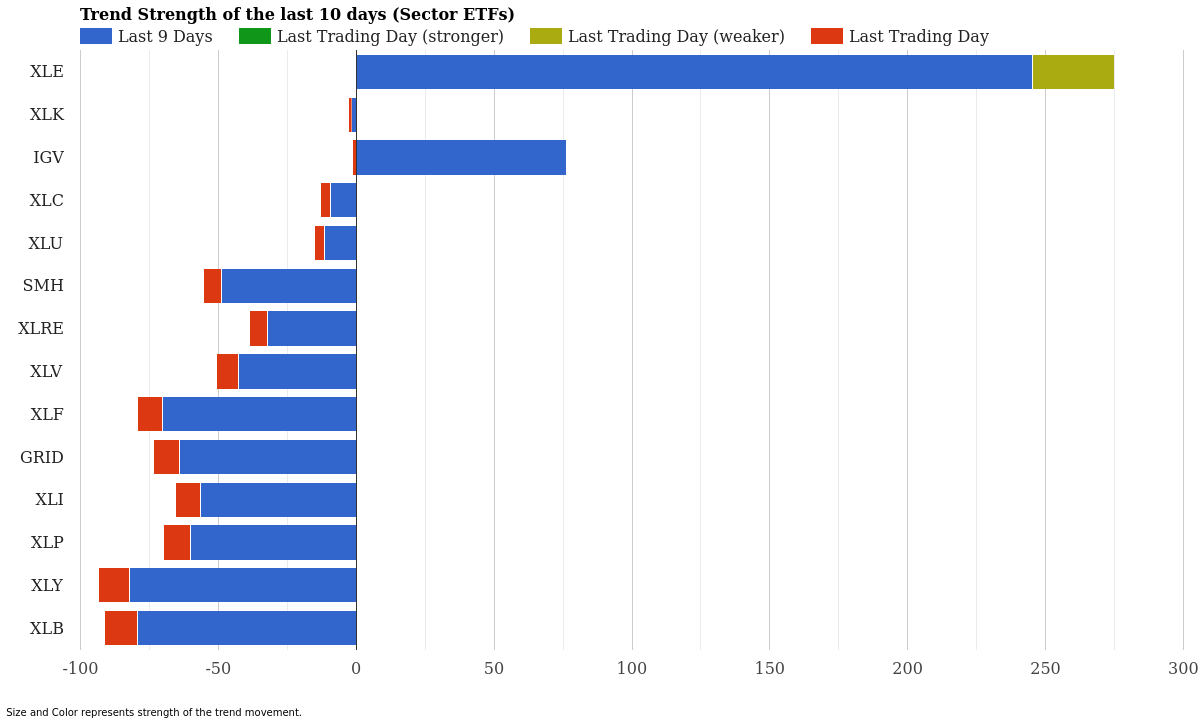
Sector ETF Trend Strength – Last 10 Days – March 30, 2026
Sector ETF Momentum Rankings
Only 2 of 14 sector ETFs show positive momentum scores over the last nine days. This concentration of weakness across traditional growth and cyclical sectors signals a significant market reorientation away from recent trends.
| Rank | ETF | 9-Day Strength | Today’s Score | Signal |
|---|---|---|---|---|
| 1 | XLE (Energy) | +245.18 | -29.95 | Weakening |
| 2 | IGV (Cloud/Software) | +76.20 | -1.37 | Slowing |
| 3 | XLK (Technology) | -1.69 | -1.18 | Downtrend |
| 4 | XLC (Communications) | -9.49 | -3.38 | Downtrend |
| 5 | XLU (Utilities) | -11.59 | -3.47 | Downtrend |
| 6 | XLRE (Real Estate) | -32.03 | -6.73 | Downtrend |
| 7 | XLV (Healthcare) | -42.87 | -7.90 | Downtrend |
| 8 | SMH (Semiconductors) | -48.92 | -6.44 | Downtrend |
| 9 | XLI (Industrials) | -56.42 | -9.23 | Downtrend |
| 10 | XLP (Consumer Staples) | -59.99 | -10.05 | Downtrend |
| 11 | GRID (Smart Grid) | -64.25 | -9.14 | Downtrend |
| 12 | XLF (Financials) | -70.34 | -8.86 | Downtrend |
| 13 | XLB (Materials) | -79.28 | -11.89 | Downtrend |
| 14 | XLY (Consumer Discretionary) | -82.40 | -11.07 | Downtrend |
Energy stands alone at the top with a +245.18 momentum score over nine days-a clear outlier. Yet today’s sharp reversal showing a momentum score of -29.95 signals that XLE’s strength is weakening, though the long-term trend remains exceptional.
Cloud and software infrastructure (IGV) managed to stay positive with +76.20 strength, but is now slowing. Everything else moves in negative territory. Materials (XLY, XLB) and financials (XLF) show the weakest momentum, each with double-digit negative momentum scores for the day. This broad decline across 12 of 14 sectors paints a picture of defensive repositioning in the equity space.
Commodity ETF Momentum Rankings
Commodities tell a different story-more bifurcated, with half the ETFs in positive territory and half struggling. Oil and agricultural commodities lead the charge.
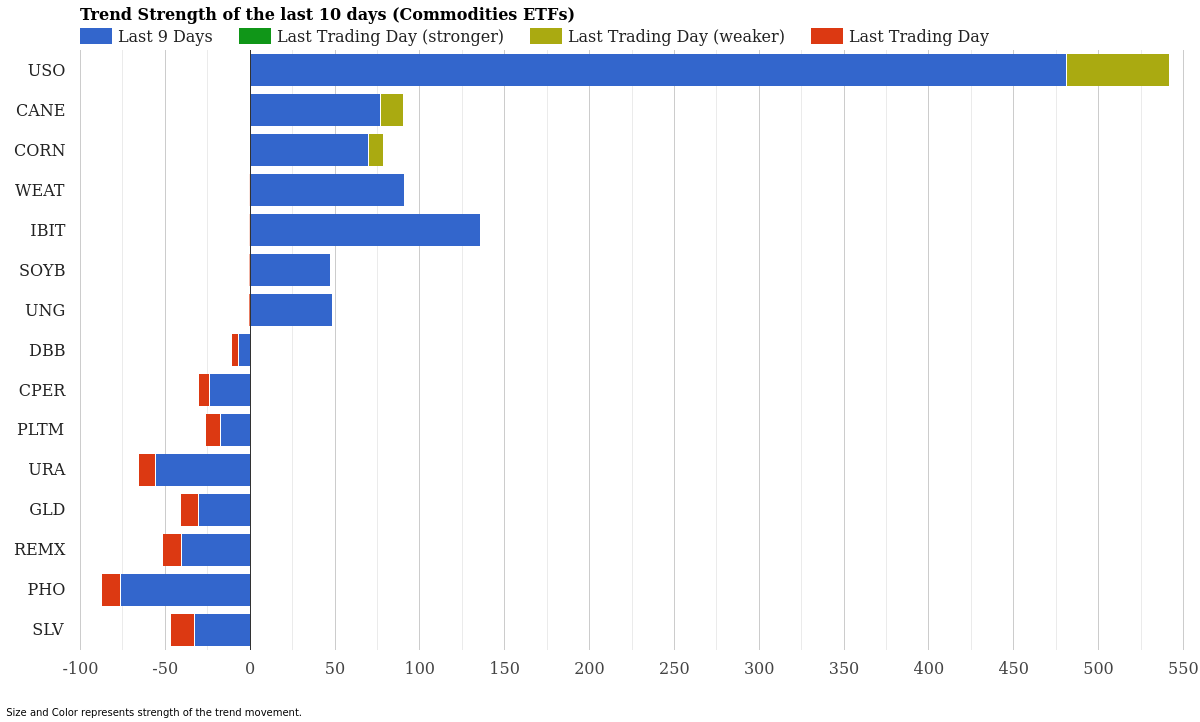
Commodity ETF Trend Strength – Last 10 Days – March 30, 2026
| Rank | ETF | 9-Day Strength | Today’s Score | Signal |
|---|---|---|---|---|
| 1 | USO (Crude Oil) | +480.99 | -60.71 | Weakening |
| 2 | IBIT (Bitcoin) | +135.79 | -0.28 | Slowing |
| 3 | WEAT (Wheat) | +90.65 | -0.24 | Slowing |
| 4 | CANE (Sugar) | +76.71 | -13.64 | Weakening |
| 5 | CORN (Corn) | +69.48 | -8.84 | Weakening |
| 6 | UNG (Natural Gas) | +48.71 | -0.63 | Slowing |
| 7 | SOYB (Soybeans) | +47.10 | -0.41 | Slowing |
| 8 | DBB (Base Metals) | -6.97 | -4.19 | Downtrend |
| 9 | PLTM (Platinum) | -17.37 | -9.09 | Downtrend |
| 10 | CPER (Copper) | -24.17 | -6.28 | Downtrend |
| 11 | GLD (Gold) | -30.70 | -10.39 | Downtrend |
| 12 | SLV (Silver) | -32.55 | -14.32 | Downtrend |
| 13 | REMX (Rare Earths) | -40.53 | -11.10 | Downtrend |
| 14 | PHO (Water) | -76.70 | -11.15 | Downtrend |
Energy commodities dominate the top rankings. USO (crude oil) boasts the exceptional momentum score of +480.99 across nine days, while IBIT (Bitcoin) sits second with +135.79. Agricultural commodities-wheat, sugar, corn, soybeans, and natural gas-all hold positive nine-day scores in the +47 to +90 range.
However, a critical shift is appearing. USO’s steep reversal with -60.71 today shows weakness breaking through that nine-day strength, even though Bitcoin and wheat merely slowed rather than reversed. Agricultural ETFs CANE and CORN are weakening too, suggesting their rallies may be losing steam.
Precious metals and rare earths remain underwater. Gold shows -30.70 nine-day strength and worsened further with -10.39 today. Silver faces even steeper pressure at -32.55 and -14.32. Water ETF (PHO) and rare earths (REMX) are among the weakest commodities overall, signaling no safe haven flow into traditional hard assets beyond energy.
Market Context & Interpretation
A striking pattern emerges when combining both datasets: energy outperforms equities dramatically, suggesting capital is rotating away from tech, consumer, and financials into commodity exposure. This movement typically signals either inflation hedging, geopolitical concern, or a shift toward value over growth.
The equity market’s broad weakness-only 2 of 14 sectors positive-paired with energy’s dominance in commodities points to a defensive stance. Investors are backing away from expensive growth names and moving toward hard assets that benefit from scarcity and inflationary pressures. Yet the reversals in USO and weakening in agricultural commodities hint that even this trade may be cooling heading into the end of Q1 2026.
Real estate, financials, and materials all show strong negative momentum, which is notable given that these typically lead market recoveries during economic expansion. Their continued weakness suggests either recession fears or a preference for other inflation hedges over traditional cyclicals.
Key ETFs to Watch
Strongest Momentum Leaders: USO dominates commodities with +480.99 nine-day strength, followed by XLE at +245.18 in equities. Both are showing weakening signals today, making them critical to monitor for trend breaks. IBIT’s +135.79 strength makes Bitcoin-linked exposure the third-strongest play across both asset classes, though also slowing.
Trend Reversal Watch: XLE deserves top attention. Its shift from +245 strength to -30 today is the single most important reversal on the board. If energy’s rally breaks here, sector rotation could accelerate dramatically. Similarly, USO’s -60.71 drop warrants close observation.
Persistent Weakness: XLY (consumer discretionary) at -82.40 and PHO (water) at -76.70 have moved so far into negative territory that mean reversion may offer opportunities for contrarian traders, though no green flags have appeared yet.
Conclusion
March 30, 2026 presents a market in flux. Energy leads with exceptional momentum, but both crude oil and the energy sector are showing signs of weakening. Equities remain broadly negative, with only energy infrastructure and cloud computing offering any upside energy. Commodities present a two-tier market: energy and agriculture ahead, while precious metals and rare earths lag sharply.
For traders, the reversals in energy assets signal caution against chasing the strongest momentum. For tactical allocators, the broad weakness across equities may present value-but the persistent downtrends suggest patience may be rewarded. Watch XLE and USO closely over the next few sessions; breaks here could signal the end of Q1’s energy narrative and trigger broader sector rebalancing.
Disclaimer: This report is for informational and educational purposes only and does not constitute investment advice. The momentum scores presented reflect technical analysis of ETF price action and are not guarantees of future performance. All investments carry risk, including potential loss of principal. Past performance does not guarantee future results. Readers should conduct their own due diligence and consult a qualified financial advisor before making investment decisions. StockBotty makes no warranties about the accuracy or timeliness of the data presented.
Author Disclosure: The author may hold or has held positions in ETF-related instruments directly or through derivative constructs at the time of publication. This analysis reflects objective technical analysis of momentum data and is not a trading recommendation for any specific instrument. Readers are encouraged to verify all data independently and form their own investment conclusions.
For more market analysis visit stockbotty.com | Disclaimer: stockbotty.com/disclaimer
—
More Momentum & Strength Articles
SHLD, GDX Lead as Utilities Plunge – Momentum August 22
Cybersecurity Climbs as Utilities Fade - August 22, 2026 Executive Summary Sector momentum shows ...
Aug 22, 2026Financials Lead, Utilities Collapse – August 21, 2026
Financials Lead as Utilities Collapse - August 21, 2026 Executive Summary Capital is rotating har...
Aug 21, 2026Commodities Lead as Sectors Fade – Momentum Rankings August 20
Commodities Surge as Tech Retreats - August 20, 2026 Executive Summary Commodity ETFs are command...
Aug 20, 2026Financials Lead as Utilities Collapse – August 19, 2026
Financials Lead as Utilities Slide - August 19, 2026 Capital is flowing into established financia...
Aug 19, 2026Financials Lead, Biotech Flips – ETF Momentum August 18
Financials Lead as Biotech Stalls - August 18, 2026 Executive Summary XLF (Financials) dominates ...
Aug 18, 2026