
Energy Surges While Sectors Reverse: ETF Momentum Shifts April 10, 2026
Executive Summary
April 10, 2026 marked a pivotal moment in the markets as 13 of 14 sector ETFs displayed reversal signals, suggesting a significant shift in momentum direction after extended weakness. Energy led the charge with an exceptional momentum score of +250.30, though showing signs of deceleration. Meanwhile, commodities painted a mixed picture with oil (USO) posting a stunning +573.16 momentum score over nine days, yet weakening sharply in today’s session. The overall market tone reflects early-stage recovery attempts across most sectors, particularly in technology, financials, and industrials-areas that had endured the heaviest selling pressure in recent days.
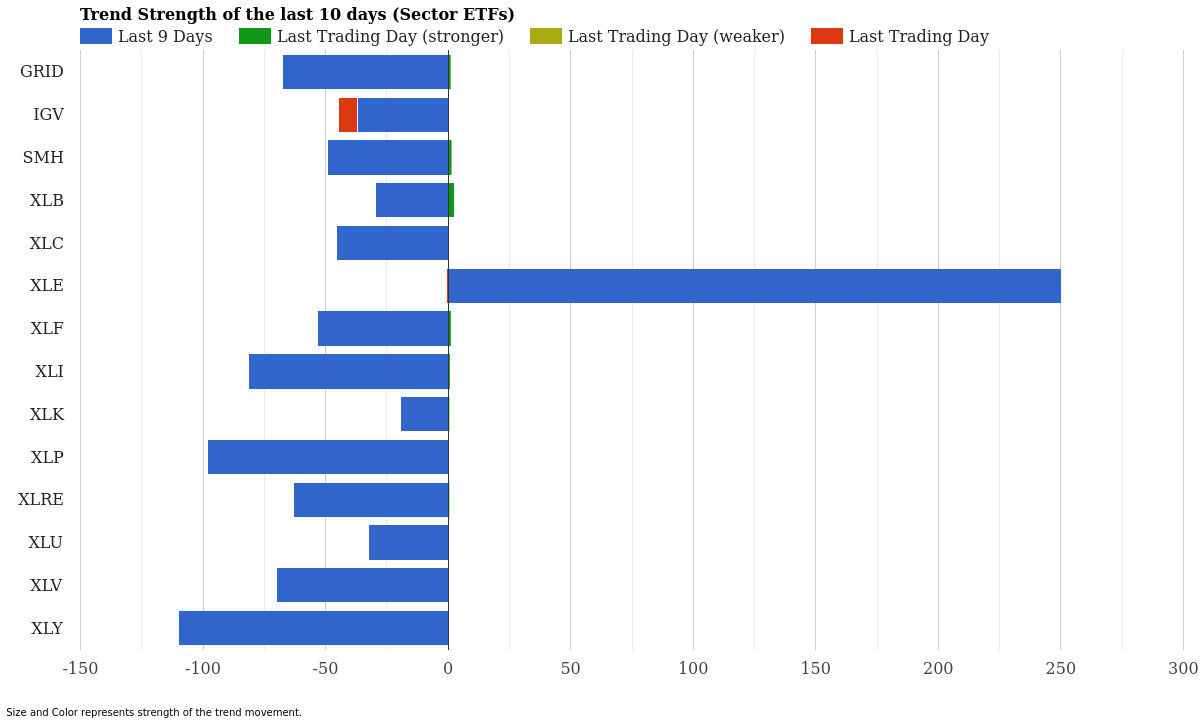
Sector ETF Trend Strength – Last 10 Days – April 10, 2026
Sector ETF Momentum Rankings
The sector landscape reveals a market in transition. While weakness dominated the nine-day trend across most groups, yesterday’s trading delivered broad reversal signals that deserve attention from momentum watchers.
| Rank | ETF | 10-Day Strength | Yesterday | Signal |
|---|---|---|---|---|
| 1 | XLE (Energy) | +250.30 | -0.53 | Slowing |
| 2 | XLK (Technology) | -19.43 | +0.49 | Reversal |
| 3 | XLB (Materials) | -29.74 | +2.77 | Reversal |
| 4 | XLU (Utilities) | -32.57 | +0.18 | Reversal |
| 5 | IGV (Software) | -37.10 | -7.76 | Downtrend |
| 6 | XLC (Communication) | -45.74 | +0.09 | Reversal |
| 7 | SMH (Semiconductors) | -49.30 | +1.37 | Reversal |
| 8 | XLF (Financials) | -53.30 | +1.11 | Reversal |
| 9 | XLRE (Real Estate) | -63.10 | +0.47 | Reversal |
| 10 | GRID (Infrastructure) | -67.58 | +1.01 | Reversal |
| 11 | XLV (Healthcare) | -69.84 | +0.23 | Reversal |
| 12 | XLI (Industrials) | -81.49 | +0.70 | Reversal |
| 13 | XLP (Consumer Staples) | -98.33 | +0.05 | Reversal |
| 14 | XLY (Consumer Discretionary) | -110.01 | +0.09 | Reversal |
XLE’s commanding lead with a momentum score of +250.30 overshadows all other sectors by a wide margin. This reflects sustained energy strength tied to global oil and commodity pressures. However, yesterday’s -0.53 contribution signals that momentum may be entering a consolidation phase rather than accelerating further.
The real story lies in the reversal signals flooding the table. Twelve sectors-including technology, semiconductors, financials, and industrials-all flipped to positive momentum contributions after prolonged weakness. Materials (XLB) led the recovery effort with a +2.77 momentum score yesterday, signaling that cyclical sectors are attracting renewed interest. Software (IGV) stands alone as the sole continued downtrend, dropping -7.76 points, suggesting investors may still be reassessing high-growth technology valuations.
Commodity ETF Momentum Rankings
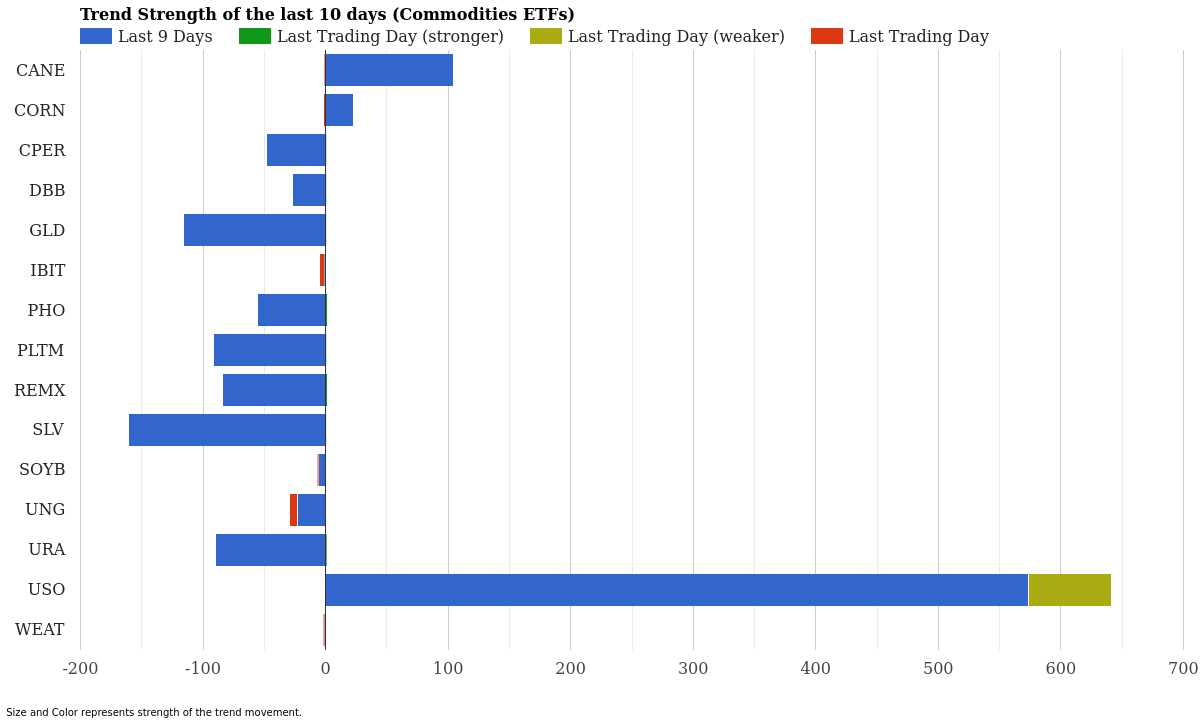
Commodity ETF Trend Strength – Last 10 Days – April 10, 2026
Commodities display more extreme swings than sectors, with oil leading the charge and precious metals languishing at the bottom. This divergence reveals important information about current market positioning and risk appetite.
| Rank | ETF | 10-Day Strength | Yesterday | Signal |
|---|---|---|---|---|
| 1 | USO (Crude Oil) | +573.16 | -68.20 | Weakening |
| 2 | CANE (Sugar) | +104.13 | -1.18 | Slowing |
| 3 | CORN (Corn) | +23.11 | -1.69 | Slowing |
| 4 | WEAT (Wheat) | -0.90 | -0.93 | Downtrend |
| 5 | IBIT (Bitcoin) | -1.24 | -4.02 | Downtrend |
| 6 | SOYB (Soybeans) | -5.80 | -0.99 | Downtrend |
| 7 | UNG (Natural Gas) | -22.83 | -6.71 | Downtrend |
| 8 | DBB (Base Metals) | -27.29 | +0.43 | Reversal |
| 9 | CPER (Copper) | -48.25 | +0.50 | Reversal |
| 10 | PHO (Water) | -55.86 | +1.18 | Reversal |
| 11 | REMX (Rare Earths) | -84.47 | +1.16 | Reversal |
| 12 | URA (Uranium) | -89.91 | +0.87 | Reversal |
| 13 | PLTM (Platinum) | -91.82 | +0.43 | Reversal |
| 14 | GLD (Gold) | -115.76 | +0.16 | Reversal |
| 15 | SLV (Silver) | -160.69 | +0.08 | Reversal |
Oil dominates the commodity space with USO’s extraordinary +573.16 momentum score-a level matched nowhere else in either sector or commodity tables. Yet yesterday’s -68.20 reading warns that this rally is losing steam rapidly. A momentum score this extreme can signal exhaustion or the completion of a major move.
Agricultural commodities (CANE, CORN) remain positive but show deceleration patterns, with sugar and corn posting negative contributions yesterday despite their nine-day strength. Precious metals present a compelling reversal story. Gold (GLD) and silver (SLV) hit the table’s lowest strength levels at -115.76 and -160.69 respectively, yet both flipped positive yesterday. This suggests oversold conditions attracting buyers.
Bitcoin (IBIT) and natural gas (UNG) stand as commodities still in downtrends without reversal signals, indicating weakness extends into these alternative assets. This contrasts sharply with the broad reversal pattern across most other commodities.
Market Context and Sector Rotation Implications
The data tells a clear story: markets experienced widespread weakness over the past nine days, but April 9 delivered a coordinated bounce that touched nearly every sector and commodity group. This suggests profit-taking, oversold rebound, or meaningful shift in sentiment-though early-stage.
XLE’s dominance reflects structural energy dynamics rather than momentum trading. Geopolitical factors, supply constraints, and inflation concerns keep crude elevated despite yesterday’s negative momentum contribution. The oil sector acts as a hedge against broader market weakness, explaining why it maintained strength when other areas struggled.
Technology and semiconductors showing reversal signals alongside financial and industrial names indicates broad-based recovery interest. If this reversal momentum persists, it would signal rotation away from defensive plays (utilities, staples, communication) and back into cyclical growth. However, the magnitude of yesterday’s gains in these sectors was tiny relative to their nine-day weakness, so confirmation is needed.
The precious metals reversal deserves attention. Gold and silver endured severe nine-day weakness, yet both turned positive yesterday. This contrasts with oil’s weakening momentum, suggesting investors may be reassessing risk allocation. Rising equity reversals combined with gold reversals suggests uncertainty rather than clear directional conviction.
Key ETFs to Watch Going Forward
Top Momentum Leaders: XLE continues its reign with +250.30 strength, followed by USO’s extraordinary +573.16 in the commodities realm. CANE and CORN round out the strength leaders with positive nine-day trends still intact.
Most Significant Reversals: Materials (XLB) with +2.77 yesterday, semiconductors (SMH) with +1.37, and infrastructure (GRID) with +1.01 show the strongest reversal momentum. In commodities, water (PHO) reversed strongly with +1.18 and rare earths (REMX) posted +1.16.
Weakest Performers Requiring Monitoring: Software (IGV) stands alone in continued downtrend with -7.76 yesterday. Consumer discretionary (XLY) and consumer staples (XLP) remain the weakest sector momentum leaders despite their reversal signals. In commodities, natural gas (UNG) at -6.71 yesterday and bitcoin (IBIT) at -4.02 show continued pressure without reversal signals.
Conclusion
April 10, 2026 marked a potential inflection point in market momentum. Twelve sector ETFs reversed course with positive contributions, commodities showed eight reversal signals, and energy continued its remarkable strength. Yet skepticism remains warranted: oil’s sharp weakening, software’s continued decline, and the overall nine-day negative backdrop suggest this may be early-stage recovery rather than sustained reversal.
Traders should monitor whether today’s reversals gain follow-through momentum. If materials, semiconductors, and financials maintain positive contributions in coming sessions, sector rotation will likely accelerate. Conversely, if weakness returns, yesterday’s bounce becomes a false signal in a continuing decline. The precious metals reversal suggests defensive positioning hasn’t completely collapsed, which could limit any new-upside moves.
Watch XLE for energy momentum sustainability, SMH and GRID for cyclical recovery confirmation, and GLD/SLV for risk-on versus risk-off clarity. The next few trading days will reveal whether this momentum shift represents genuine market repricing or a temporary bounce in a continued downtrend.
For more market analysis visit stockbotty.com | Disclaimer: stockbotty.com/disclaimer
—
More Momentum & Strength Articles
SHLD, GDX Lead as Utilities Plunge – Momentum August 22
Cybersecurity Climbs as Utilities Fade - August 22, 2026 Executive Summary Sector momentum shows ...
Aug 22, 2026Financials Lead, Utilities Collapse – August 21, 2026
Financials Lead as Utilities Collapse - August 21, 2026 Executive Summary Capital is rotating har...
Aug 21, 2026Commodities Lead as Sectors Fade – Momentum Rankings August 20
Commodities Surge as Tech Retreats - August 20, 2026 Executive Summary Commodity ETFs are command...
Aug 20, 2026Financials Lead as Utilities Collapse – August 19, 2026
Financials Lead as Utilities Slide - August 19, 2026 Capital is flowing into established financia...
Aug 19, 2026Financials Lead, Biotech Flips – ETF Momentum August 18
Financials Lead as Biotech Stalls - August 18, 2026 Executive Summary XLF (Financials) dominates ...
Aug 18, 2026