
Energy Leads While Tech Retreats: ETF Momentum Shifts on April 07, 2026
April 7, 2026 brought a tale of two markets. Energy ETFs surged with exceptional momentum while technology and consumer discretionary sectors faced significant headwinds. The broader market saw 12 out of 14 sector ETFs trading with negative trend momentum over the past nine days, signaling a pronounced shift away from growth-oriented holdings. Meanwhile, commodity markets showed more mixed signals, with oil-related ETFs leading gains while precious metals continued their downward slide. All data reflects trading activity from April 6, 2026’s session.
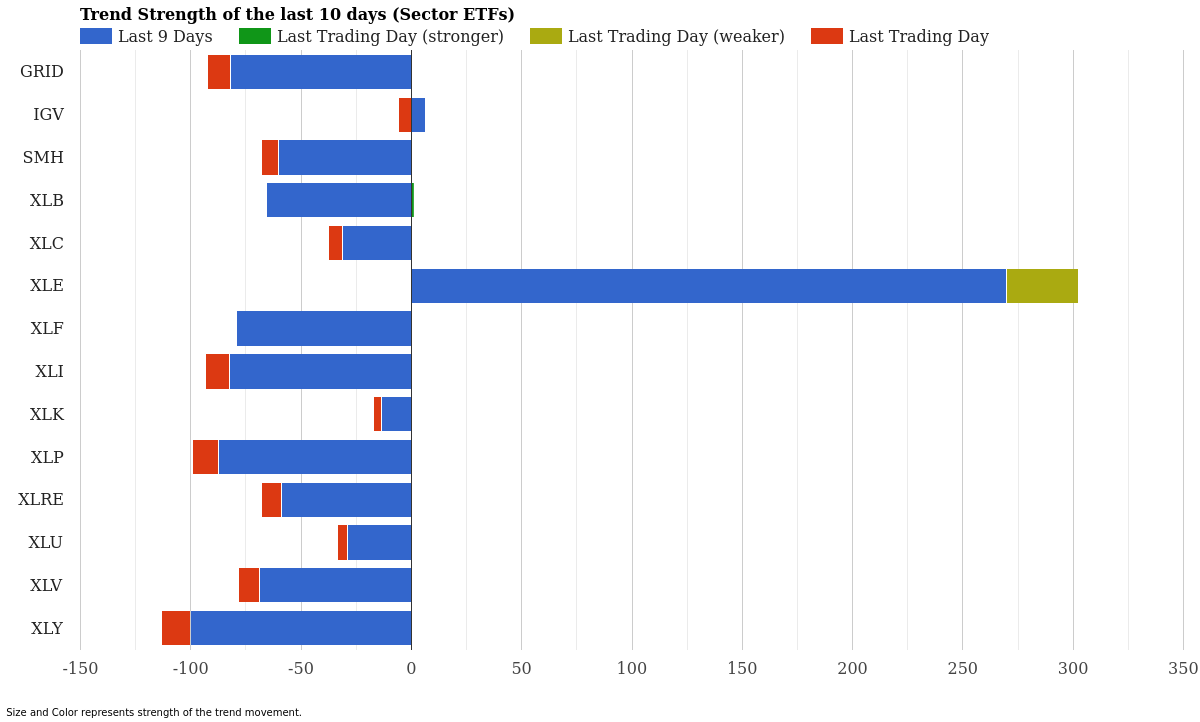
Sector ETF Trend Strength – Last 10 Days – April 07, 2026
Sector ETF Momentum Rankings
| Rank | ETF | 10-Day Strength | Today’s Score | Signal |
|---|---|---|---|---|
| 1 | XLE (Energy) | +269.87 | -32.44 | Weakening |
| 2 | IGV (Software) | +6.20 | -6.03 | Slowing |
| 3 | XLK (Technology) | -13.37 | -3.60 | Downtrend |
| 4 | XLU (Utilities) | -29.00 | -4.60 | Downtrend |
| 5 | XLC (Communication) | -31.43 | -6.27 | Downtrend |
| 6 | XLRE (Real Estate) | -58.96 | -8.92 | Downtrend |
| 7 | SMH (Semiconductors) | -60.06 | -7.86 | Downtrend |
| 8 | XLB (Materials) | -65.90 | +1.10 | Reversal |
| 9 | XLV (Healthcare) | -69.08 | -9.42 | Downtrend |
| 10 | XLF (Financials) | -79.47 | +0.10 | Reversal |
| 11 | GRID (Utilities Infrastructure) | -82.08 | -10.27 | Downtrend |
| 12 | XLI (Industrials) | -82.51 | -11.04 | Downtrend |
| 13 | XLP (Consumer Staples) | -87.49 | -11.55 | Downtrend |
| 14 | XLY (Consumer Discretionary) | -100.23 | -13.00 | Downtrend |
Energy dominates the sector landscape with XLE posting a stellar momentum score of +269.87 over nine days. However, yesterday’s weakness signal tells an important story – the sector shed -32.44 momentum points on April 6. This reversal pattern suggests energy’s bull run may be losing steam even as it maintains the strongest position overall.
The technology sector presents a cautionary tale for growth investors. XLK trades deep in negative territory with a momentum score of -13.37, while semiconductor-focused SMH sits even deeper at -60.06. Software ETF IGV remains one of only two positive-trended sectors, but its trajectory is slowing significantly.
Two critical reversals emerged on April 6. Materials (XLB) and Financials (XLF) both flipped positive after prolonged downtrends, suggesting tentative buying interest in previously beaten-down sectors. Consumer discretionary hit the weakest point, with XLY’s momentum score reaching -100.23 – a tell-tale sign of sustained selling pressure in that market segment.
Commodity ETF Momentum Rankings
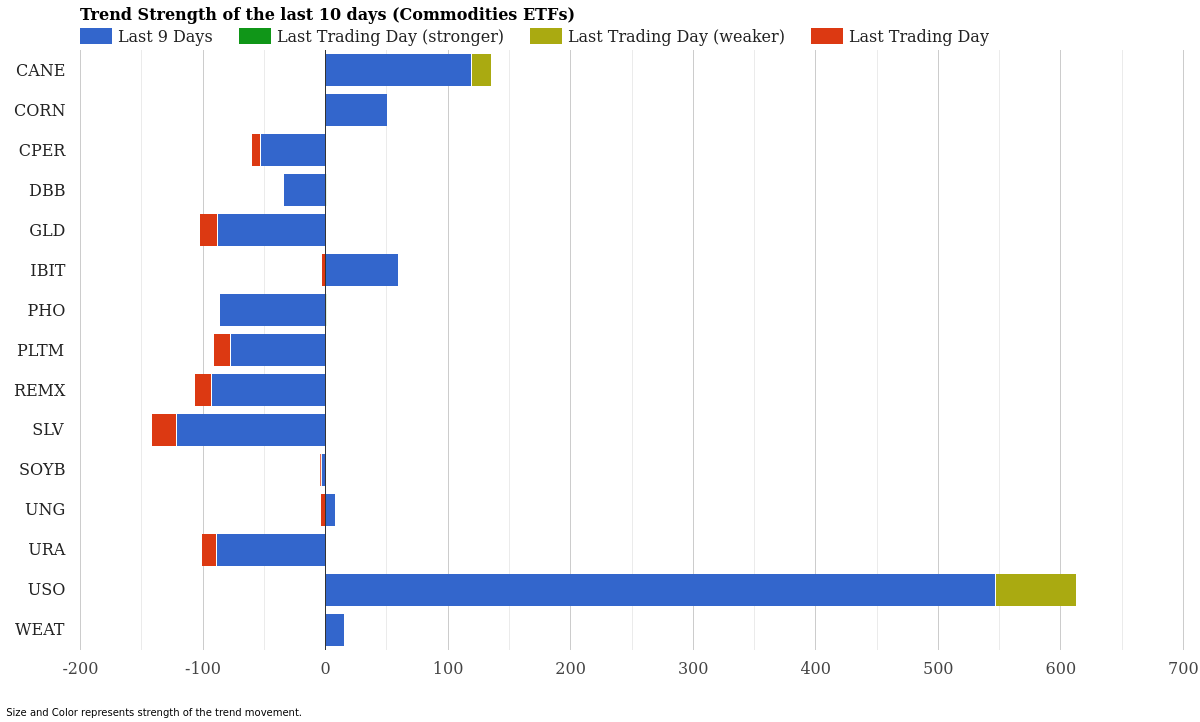
Commodity ETF Trend Strength – Last 10 Days – April 07, 2026
| Rank | ETF | 10-Day Strength | Today’s Score | Signal |
|---|---|---|---|---|
| 1 | USO (Crude Oil) | +547.00 | -65.71 | Weakening |
| 2 | CANE (Sugar) | +119.31 | -16.40 | Weakening |
| 3 | IBIT (Bitcoin) | +59.53 | -3.26 | Slowing |
| 4 | CORN (Corn) | +50.84 | -0.61 | Slowing |
| 5 | WEAT (Wheat) | +15.43 | -0.10 | Slowing |
| 6 | UNG (Natural Gas) | +7.82 | -3.83 | Slowing |
| 7 | SOYB (Soybeans) | -3.73 | -0.80 | Downtrend |
| 8 | DBB (Metals) | -34.50 | +0.01 | Reversal |
| 9 | CPER (Copper) | -53.18 | -7.56 | Downtrend |
| 10 | PLTM (Platinum) | -77.96 | -13.57 | Downtrend |
| 11 | PHO (Water) | -86.60 | +0.12 | Reversal |
| 12 | GLD (Gold) | -88.30 | -14.54 | Downtrend |
| 13 | URA (Uranium) | -89.23 | -12.20 | Downtrend |
| 14 | REMX (Rare Earths) | -93.45 | -13.28 | Downtrend |
| 15 | SLV (Silver) | -121.91 | -20.23 | Downtrend |
Crude oil towers above all other commodities with an extraordinary momentum score of +547.00 – the highest momentum value across all tracked instruments. Yet USO’s weakness signal reveals the same pattern: strong recent gains are beginning to fade with a -65.71 score retreat on April 6.
Sugar (CANE) and grain-based contracts show more modest positive momentum. CORN sits at +50.84 while WEAT remains nearly flat with +15.43. These agricultural plays are slowing but have not yet turned negative, suggesting careful consolidation rather than outright breakdown.
Precious metals face sustained selling pressure. Silver (SLV) represents the weakest momentum on the entire platform with -121.91 momentum score over nine days and continues bleeding momentum daily. Gold (GLD) at -88.30 tells a similar story. Both DBB (metals basket) and PHO (water) flipped positive on April 6, providing the only bright spots in the commodity downturn.
Market Context and Interpretation
The market narrative for April 7 centers on a significant sector rotation away from growth and toward energy. With 12 out of 14 sectors showing negative momentum, money is not flowing broadly across equities but rather concentrating in specific pockets – particularly crude oil and its related sectors.
Energy’s dominance despite showing weakness signals that traders are protecting gains rather than abandoning the trade entirely. This pattern often precedes either a consolidation period or a reversal. The fact that energy is weakening while other sectors remain in deeper downtrends suggests portfolio managers are rotating OUT of growth and INTO value-oriented energy positions.
Technology’s sustained weakness is particularly notable. The -13.37 momentum for XLK and -60.06 for SMH indicate that semiconductor and software traders are hitting the exit doors, not walking.
On the commodity side, the crude oil rally that powered USO’s +547.00 score appears overextended. Traditional safe-haven plays like gold and silver remain under pressure, which typically signals continued confidence in economic growth despite stock market weakness. However, the severity of precious metals’ decline suggests either significant liquidation or a genuine shift in inflation expectations.
Key ETFs to Watch
Strongest Performers: USO leads with unmatched momentum despite yesterday’s pullback. XLE ranks second globally with +269.87, making these two energy-linked vehicles the clear focus of capital flows. CANE’s +119.31 puts agricultural commodities in third place, though with less aggressive positioning.
Critical Reversals to Monitor: XLB and XLF both showed positive signals on April 6 after extended downtrends, suggesting institutional interest in materials and financials. These reversals warrant close observation – if momentum builds on April 7, they could signal a broader market bottom. Conversely, DBB and PHO represent potential turning points in the metals and water sectors, though from much deeper negative positions.
Risks on the Horizon: SLV at -121.91 presents the most aggressive downtrend anywhere. XLY’s -100.23 suggests consumer discretionary faces structural headwinds, not temporary weakness. These two should remain on watch lists for further deterioration or potential capitulation washouts.
Conclusion
April 6, 2026 painted a portrait of a market in transition. Energy leads decisively while growth sectors stumble, precious metals face capitulation-grade selling, and critical technical reversals have emerged in materials and financials. The weakening signals in both USO and XLE despite their leading momentum scores suggest the rally may be hitting resistance.
For active traders and investors, today’s data highlights three key themes: first, the energy rally is slowing; second, value is beginning to outperform growth; and third, a potential floor may be forming in deeply beaten-down sectors like materials and financials. The next session will be critical in determining whether these reversals represent genuine capitulation buying or false starts in a continued downtrend.
Watch for momentum confirmation on April 7. If XLB, XLF, DBB, and PHO sustain their positive reversals while the weakening trend in XLY and SLV continues, expect more pronounced sector rotation. Until then, treat energy’s weakness as a caution flag – even dominant trends can lose steam quickly when momentum scores begin declining substantially.
For more market analysis visit stockbotty.com | Disclaimer: stockbotty.com/disclaimer
—
More Momentum & Strength Articles
SHLD, GDX Lead as Utilities Plunge – Momentum August 22
Cybersecurity Climbs as Utilities Fade - August 22, 2026 Executive Summary Sector momentum shows ...
Aug 22, 2026Financials Lead, Utilities Collapse – August 21, 2026
Financials Lead as Utilities Collapse - August 21, 2026 Executive Summary Capital is rotating har...
Aug 21, 2026Commodities Lead as Sectors Fade – Momentum Rankings August 20
Commodities Surge as Tech Retreats - August 20, 2026 Executive Summary Commodity ETFs are command...
Aug 20, 2026Financials Lead as Utilities Collapse – August 19, 2026
Financials Lead as Utilities Slide - August 19, 2026 Capital is flowing into established financia...
Aug 19, 2026Financials Lead, Biotech Flips – ETF Momentum August 18
Financials Lead as Biotech Stalls - August 18, 2026 Executive Summary XLF (Financials) dominates ...
Aug 18, 2026