
Energy Surges While Tech Stumbles: ETF Momentum Shifts April 02, 2026
April 02, 2026 brought a tale of two markets. Energy ETFs powered ahead with remarkable momentum while technology and consumer-focused sectors retreated sharply. Oil surged with a momentum score of +526.49, dominating commodities, but the broader market picture shows cautious positioning with 12 of 14 sector ETFs trending downward. This divergence signals active sector rotation-money is flowing selectively into energy and select commodities while pulling back from growth-heavy segments.
The session reflected yesterday’s price action across the board. Here’s what changed, and what it means for your portfolio.
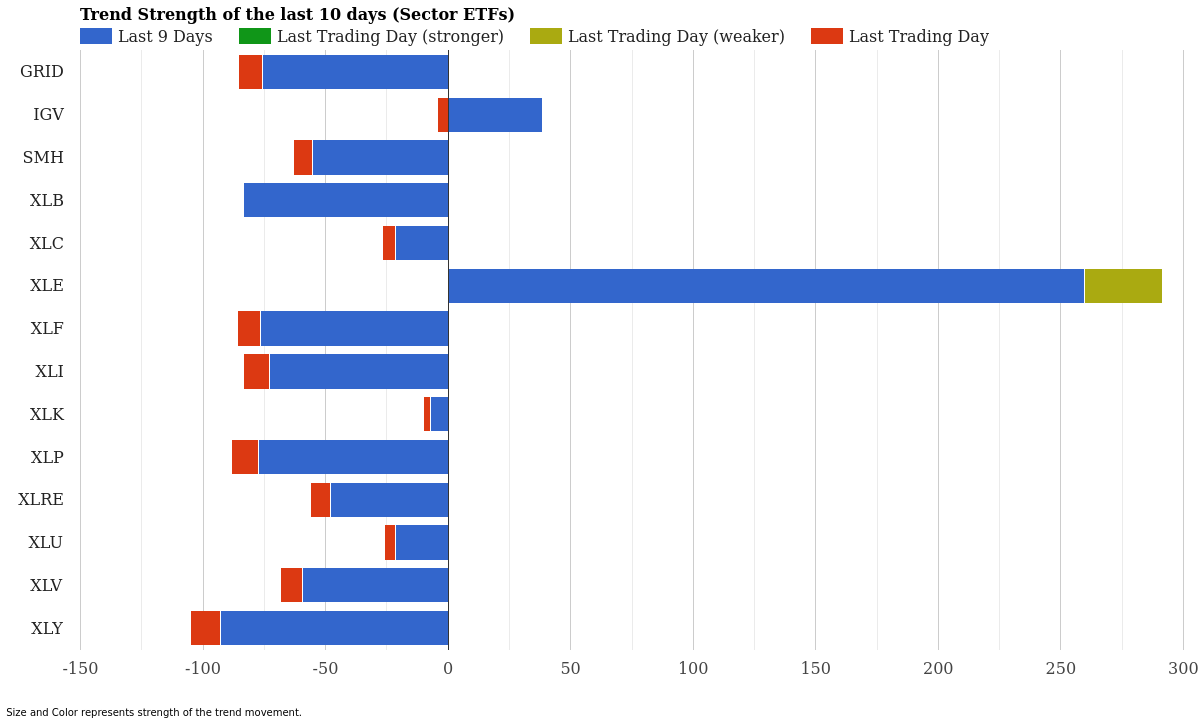
Sector ETF Trend Strength – Last 10 Days – April 02, 2026
Sector ETF Momentum Rankings
Energy leads by a commanding margin, but the broader picture reveals widespread weakness across traditional growth and defensive holdings. XLE’s momentum score of +259.48 over the last nine days demonstrates the sector’s resilience, though yesterday’s momentum score of -31.92 signals weakening. Meanwhile, consumer discretionary (XLY) sank to -92.83 on nine-day strength, with yesterday accelerating losses.
| Rank | ETF | 10-Day Strength | Yesterday | Signal |
|---|---|---|---|---|
| 1 | XLE | +259.48 | -31.92 | Weakening |
| 2 | IGV | +38.56 | -4.29 | Slowing |
| 3 | XLK | -7.31 | -2.87 | Downtrend |
| 4 | XLC | -21.38 | -5.45 | Downtrend |
| 5 | XLU | -21.66 | -4.39 | Downtrend |
| 6 | XLRE | -47.81 | -8.47 | Downtrend |
| 7 | SMH | -55.50 | -7.56 | Downtrend |
| 8 | XLV | -59.24 | -9.15 | Downtrend |
| 9 | XLI | -72.91 | -10.68 | Downtrend |
| 10 | GRID | -75.55 | -10.14 | Downtrend |
| 11 | XLF | -76.55 | -9.26 | Downtrend |
| 12 | XLP | -77.28 | -11.17 | Downtrend |
| 13 | XLB | -83.67 | +0.30 | Reversal |
| 14 | XLY | -92.83 | -12.40 | Downtrend |
XLB (materials) stands out with a trend reversal-after nine days of negative momentum at -83.67, yesterday showed a positive momentum score of +0.30. This shift suggests potential stabilization in commodities-linked sectors, though confirmation is needed over the coming days.
Consumer discretionary (XLY) remains the weakest performer with a nine-day momentum score of -92.83 and yesterday’s decline of -12.40. This reflects pulling back from growth-heavy retail and leisure stocks. Industrials, financials, and consumer staples also show persistent downward pressure, signaling caution across the board.
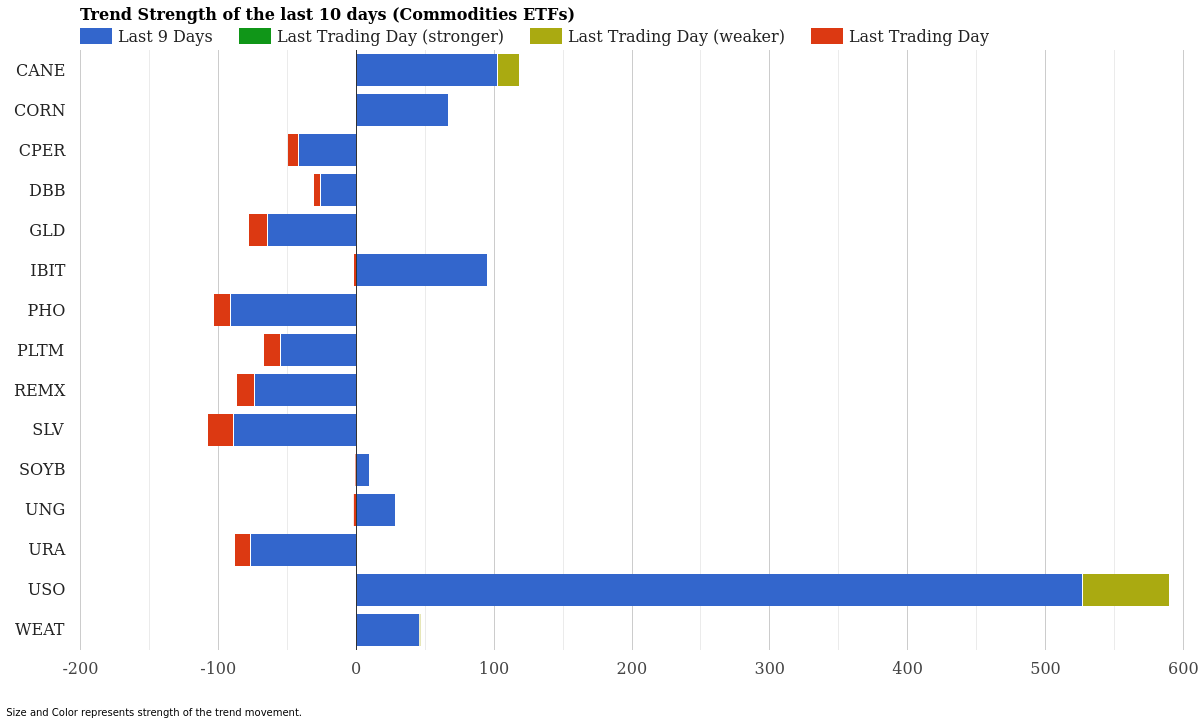
Commodity ETF Trend Strength – Last 10 Days – April 02, 2026
Commodity ETF Momentum Rankings
| Rank | ETF | 10-Day Strength | Yesterday | Signal |
|---|---|---|---|---|
| 1 | USO | +526.49 | -63.39 | Weakening |
| 2 | CANE | +102.47 | -15.93 | Weakening |
| 3 | IBIT | +95.03 | -2.01 | Slowing |
| 4 | CORN | +66.67 | -0.16 | Slowing |
| 5 | WEAT | +46.06 | -0.15 | Weakening |
| 6 | UNG | +28.15 | -2.16 | Slowing |
| 7 | SOYB | +9.76 | -0.66 | Slowing |
| 8 | DBB | -25.70 | -5.07 | Downtrend |
| 9 | CPER | -42.19 | -7.42 | Downtrend |
| 10 | PLTM | -55.08 | -12.50 | Downtrend |
| 11 | GLD | -64.56 | -13.63 | Downtrend |
| 12 | REMX | -73.83 | -12.90 | Downtrend |
| 13 | URA | -76.41 | -11.86 | Downtrend |
| 14 | SLV | -88.92 | -18.69 | Downtrend |
| 15 | PHO | -91.40 | -11.85 | Downtrend |
Oil and agricultural commodities lead the momentum race, but they’re showing signs of fatigue. USO’s exceptional nine-day strength of +526.49 reflects sustained energy demand, yet yesterday’s momentum score of -63.39 indicates weakening. This pattern-strong uptrend but losing steam-appears across energy commodities including CANE (sugar) and agricultural futures.
Precious metals and industrial metals tell a different story. Silver (SLV) suffered the steepest decline among commodities, with a momentum score of -88.92 over nine days and yesterday’s -18.69 drop. Uranium (URA), rare earths (REMX), and platinum (PLTM) also retreated sharply, signaling reduced risk appetite and weakening demand expectations.
Market Context and Sector Rotation Insight
The big picture reveals a market in transition. Broad sector weakness combined with selective commodity strength suggests investors are rotating capital away from growth and into inflation hedges-primarily energy. This is classic risk-off positioning when confidence in economic growth wavers.
Energy’s momentum advantage is undeniable, but the weakening signals on both USO and XLE raise questions about sustainability. When the strongest performer shows fatigue, it often marks a turning point. Watch whether energy holds gains or momentum reverses like we’re seeing in precious metals.
Technology weakness (XLK: -7.31 nine-day) paired with consumer discretionary collapse (XLY: -92.83) suggests growth expectations are compressing. Meanwhile, defensive sectors like utilities (XLU) and staples (XLP) also retreated, meaning flight-to-safety isn’t happening in typical defensive areas either.
This unusual pattern-weakness across both growth and defensive sectors, with energy as sole bright spot-points to macro uncertainty rather than typical sector rotation. Rising energy costs, inflation concerns, or supply shocks could all trigger this response.
Key ETFs to Watch
XLE (Energy Select Sector) remains the strongest performer with a +259.48 momentum score, but weakening signals suggest watching for reversal. If energy momentum breaks, broad market weakness could accelerate.
USO (Oil ETF) carries the highest absolute momentum at +526.49 but showed the largest single-day decline in commodities (-63.39). This is the most critical “check the charts” moment in today’s data.
XLB (Materials) reversal from -83.67 to +0.30 deserves monitoring. If materials stabilize, it could signal bottom-fishing ahead of economic recovery or industrial demand pickup.
XLY (Consumer Discretionary) at -92.83 is the weakest sector ETF. This extreme weakness in discretionary spending ETFs warrants attention-it reflects either reduced consumer confidence or tight valuations that justify selling.
What This Means for Your Portfolio
If you hold large positions in technology, consumer stocks, or traditional defensive sectors, today’s momentum data confirms broad weakness. The energy trade is still alive, but at weakening strength levels, meaning new positions should be approached cautiously.
Commodity investors face a split market. Energy commodities retain upward momentum but show exhaustion. Precious metals have fallen consistently, offering contrarian opportunities for those betting on defensive reversals-or confirmation that growth fears are overblown.
The absence of typical safe-haven strength (weakness in both utilities and staples) is a yellow flag. Markets normally reward defensive plays during uncertainty. That they’re not suggests something deeper-perhaps rate expectations, credit concerns, or near-term economic data-deserves your attention.
Conclusion
April 02, 2026 painted a portrait of selective strength in energy masking broad sector weakness. Energy momentum remains positive but is fading fast, while precious metals and industrial commodities have rolled over decisively. Most crucially, the weakness spreads across growth and defensive sectors alike, breaking the typical rotation pattern.
This is a market hesitant about growth prospects but not yet fully committed to defensive positioning. The coming days will reveal whether energy weakness accelerates selling pressure or whether commodities stabilize and support broader recovery. Monitor XLE and USO momentum carefully-they’re your leading indicators.
The trend reversal in XLB is a small bright spot worth tracking. If materials confirm stabilization, it could signal the bottom isn’t far. Until then, this market rewards selectivity and punishes broad exposure.
For more market analysis visit stockbotty.com | Disclaimer: stockbotty.com/disclaimer
—
More Momentum & Strength Articles
SHLD, GDX Lead as Utilities Plunge – Momentum August 22
Cybersecurity Climbs as Utilities Fade - August 22, 2026 Executive Summary Sector momentum shows ...
Aug 22, 2026Financials Lead, Utilities Collapse – August 21, 2026
Financials Lead as Utilities Collapse - August 21, 2026 Executive Summary Capital is rotating har...
Aug 21, 2026Commodities Lead as Sectors Fade – Momentum Rankings August 20
Commodities Surge as Tech Retreats - August 20, 2026 Executive Summary Commodity ETFs are command...
Aug 20, 2026Financials Lead as Utilities Collapse – August 19, 2026
Financials Lead as Utilities Slide - August 19, 2026 Capital is flowing into established financia...
Aug 19, 2026Financials Lead, Biotech Flips – ETF Momentum August 18
Financials Lead as Biotech Stalls - August 18, 2026 Executive Summary XLF (Financials) dominates ...
Aug 18, 2026