
Energy Powers Forward as Tech Tumbles: March 24 Momentum Shift
Executive Summary
Markets on March 24, 2026 revealed a striking divergence: commodities and energy surge while traditional sectors retreat sharply. Energy ETF XLE dominates with a +232.52 momentum score over the last nine trading days, though yesterday’s session showed weakness signaling potential consolidation. Meanwhile, four of the top fourteen sector ETFs flipped negative, with discretionary (XLY) and financials (XLF) leading the decline. Commodities tell a different story-12 of 15 commodity ETFs maintain positive momentum, led by crude oil (USO) and wheat futures (WEAT), indicating sustained demand for hard assets and inflation hedges.
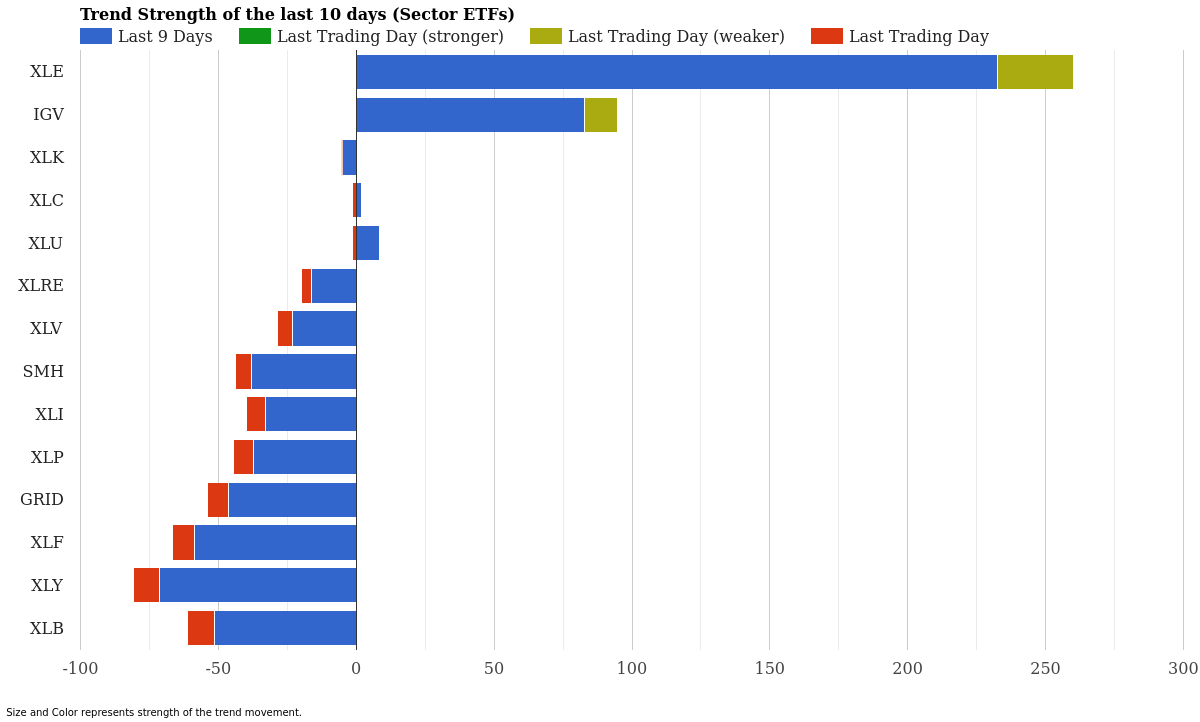
Sector ETF Trend Strength – Last 10 Days – March 24, 2026
Sector ETF Momentum Rankings
Energy and software fight for investor attention, but the broader sector picture tilts bearish. Examine the complete rankings below to understand where institutional flows are shifting.
| Rank | ETF | 10-Day Strength | Yesterday | Signal |
|---|---|---|---|---|
| 1 | XLE | +232.52 | -27.57 | Weakening |
| 2 | IGV | +82.94 | -11.77 | Weakening |
| 3 | XLU | +8.52 | -1.34 | Slowing |
| 4 | XLC | +1.77 | -1.21 | Slowing |
| 5 | XLK | -5.07 | -0.22 | Downtrend |
| 6 | XLRE | -16.13 | -3.83 | Downtrend |
| 7 | XLV | -23.25 | -5.31 | Downtrend |
| 8 | XLI | -32.87 | -7.01 | Downtrend |
| 9 | XLP | -37.42 | -7.25 | Downtrend |
| 10 | SMH | -37.81 | -5.82 | Downtrend |
| 11 | GRID | -46.35 | -7.67 | Downtrend |
| 12 | XLB | -51.45 | -9.71 | Downtrend |
| 13 | XLF | -58.49 | -8.19 | Downtrend |
| 14 | XLY | -71.21 | -9.51 | Downtrend |
A tale of two momentum trends emerges from sector data. Energy (XLE) and software (IGV) lead decisively with +232.52 and +82.94 momentum scores respectively, yet both flashed weakening signals yesterday-suggesting momentum may be pausing for consolidation.
Below these leaders, the picture deteriorates rapidly. Discretionary stocks (XLY) collapsed to -71.21, joined by financials (XLF) at -58.49 and materials (XLB) at -51.45. Semiconductors (SMH) and utilities infrastructure (GRID) also entered negative territory. This tells a story of investor rotation away from cyclical growth plays toward defensive positioning.
Commodity ETF Momentum Rankings
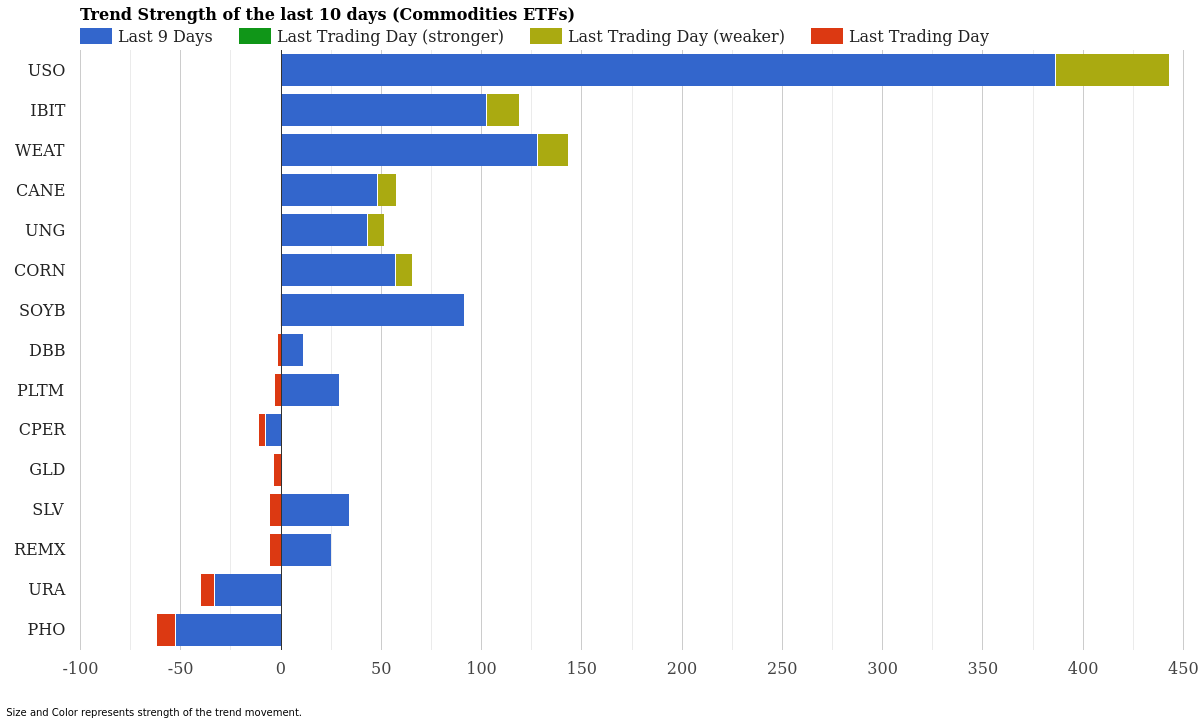
Commodity ETF Trend Strength – Last 10 Days – March 24, 2026
Commodities paint an entirely different canvas. Crude oil (USO) dominates with an exceptional +386.39 momentum score, signaling sustained demand and geopolitical premium. Wheat (WEAT) follows with +127.68, and Bitcoin exposure (IBIT) checks in at +102.48.
| Rank | ETF | 10-Day Strength | Yesterday | Signal |
|---|---|---|---|---|
| 1 | USO | +386.39 | -56.81 | Weakening |
| 2 | WEAT | +127.68 | -15.61 | Weakening |
| 3 | IBIT | +102.48 | -16.30 | Weakening |
| 4 | SOYB | +91.26 | -0.09 | Slowing |
| 5 | CORN | +57.32 | -8.09 | Weakening |
| 6 | CANE | +48.28 | -9.17 | Weakening |
| 7 | UNG | +43.19 | -8.27 | Weakening |
| 8 | SLV | +34.15 | -5.51 | Slowing |
| 9 | PLTM | +28.90 | -3.07 | Slowing |
| 10 | REMX | +24.99 | -5.64 | Slowing |
| 11 | DBB | +11.40 | -1.62 | Slowing |
| 12 | GLD | +0.49 | -3.93 | Slowing |
| 13 | CPER | -7.80 | -3.23 | Downtrend |
| 14 | URA | -33.13 | -6.93 | Downtrend |
| 15 | PHO | -52.57 | -9.31 | Downtrend |
Energy commodities dominate the commodity scorecard. Agricultural plays (corn, soybeans, wheat, sugar) all show strong positive momentum scores, reflecting global supply concerns and food price inflation. Yet nearly all leaders flashed weakening signals yesterday-consistent with the sector ETF story of consolidation after strong rallies.
Only three commodity ETFs went deeply negative: uranium (URA) at -33.13, water infrastructure (PHO) at -52.57, and copper (CPER) at -7.80. The absence of broad commodity weakness despite sector rotation suggests institutional conviction in hard asset values amid inflation hedging.
Market Context and Interpretation
What’s happening here? Two distinct market rotations collide simultaneously.
First, a classic risk-off shift from growth and cyclical sectors toward defensive positioning. Discretionary stocks (XLY), semiconductors (SMH), financials (XLF), and materials (XLB) all print significant negative momentum. This pattern typically accompanies rising rate expectations, recession concerns, or flight-to-quality dynamics. Investors are stepping away from leverage-sensitive sectors.
Second, a powerful rotation into commodities and real assets. Energy leads with unprecedented momentum (+386 for USO), while agricultural futures rally sharply. This divergence suggests markets perceive structural inflation-the kind that favors hard assets over equities carrying multiple compression risk.
The weakening signals in top commodity leaders matter. USO, WEAT, IBIT, and others showed large negative swings yesterday despite holding strong nine-day momentum. This suggests profit-taking at technical resistance levels rather than trend reversal. Watch whether these bounce back tomorrow or break below support.
Energy (XLE) and software (IGV) weaken in tandem, creating an unusual dynamic. XLE weakness despite oil strength hints at sector-specific headwinds-perhaps geopolitical calming or production data. IGV weakness reflects broader tech pressure even as investors rotate into energy infrastructure software.
Key ETFs to Watch
Top Three Momentum Leaders: USO’s +386.39 score stands unmatched, followed by XLE at +232.52 and WEAT at +127.68. All three weakened yesterday, signaling consolidation. Traders should watch for either bounce-backs confirming the trend or breaks below key support indicating reversal.
Critical Reversals to Monitor: XLY’s -71.21 momentum score represents the worst sector performer. This aggressive discretionary sell-off warrants attention-if it stabilizes, it could signal bottom. If it breaks lower, consumer confidence may deteriorate further.
Weakest Performers: Water (PHO) at -52.57 and uranium (URA) at -33.13 remain deeply underwater. These structural weakness signals persist despite commodity rally strength elsewhere.
Conclusion
March 24, 2026 captures a market in transition. Sectors retreat sharply while commodities surge-a classic risk-off rotation with inflation hedge undertones. Top performers (USO, XLE, WEAT) all showed weakening signals yesterday, suggesting consolidation rather than capitulation. Traders face a delicate setup: will weakening leaders bounce and resume trends, or roll over into reversals?
The answer likely hinges on macroeconomic data arriving this week. Until then, expect elevated volatility in energy and technology names while commodity strength persists-but watch those weakening signals closely for trend exhaustion clues.
For more market analysis, visit stockbotty.com | Disclaimer: stockbotty.com/disclaimer
—
More Momentum & Strength Articles
SHLD, GDX Lead as Utilities Plunge – Momentum August 22
Cybersecurity Climbs as Utilities Fade - August 22, 2026 Executive Summary Sector momentum shows ...
Aug 22, 2026Financials Lead, Utilities Collapse – August 21, 2026
Financials Lead as Utilities Collapse - August 21, 2026 Executive Summary Capital is rotating har...
Aug 21, 2026Commodities Lead as Sectors Fade – Momentum Rankings August 20
Commodities Surge as Tech Retreats - August 20, 2026 Executive Summary Commodity ETFs are command...
Aug 20, 2026Financials Lead as Utilities Collapse – August 19, 2026
Financials Lead as Utilities Slide - August 19, 2026 Capital is flowing into established financia...
Aug 19, 2026Financials Lead, Biotech Flips – ETF Momentum August 18
Financials Lead as Biotech Stalls - August 18, 2026 Executive Summary XLF (Financials) dominates ...
Aug 18, 2026