
Energy Surges While Financials Crumble: March 31, 2026 ETF Momentum Snapshot
Today’s market tells a story of dramatic sector rotation. Energy ETFs are leading with exceptional momentum, while financial services, consumer discretionary, and materials sectors face relentless selling pressure. Among commodities, crude oil and agricultural products show resilience despite signs of fatigue, while precious metals continue their downward march. This divergence suggests investors are reshuffling portfolios ahead of potential economic shifts.
All data reflects trading activity from March 30, 2026, providing a window into where institutional and retail money moved most recently.
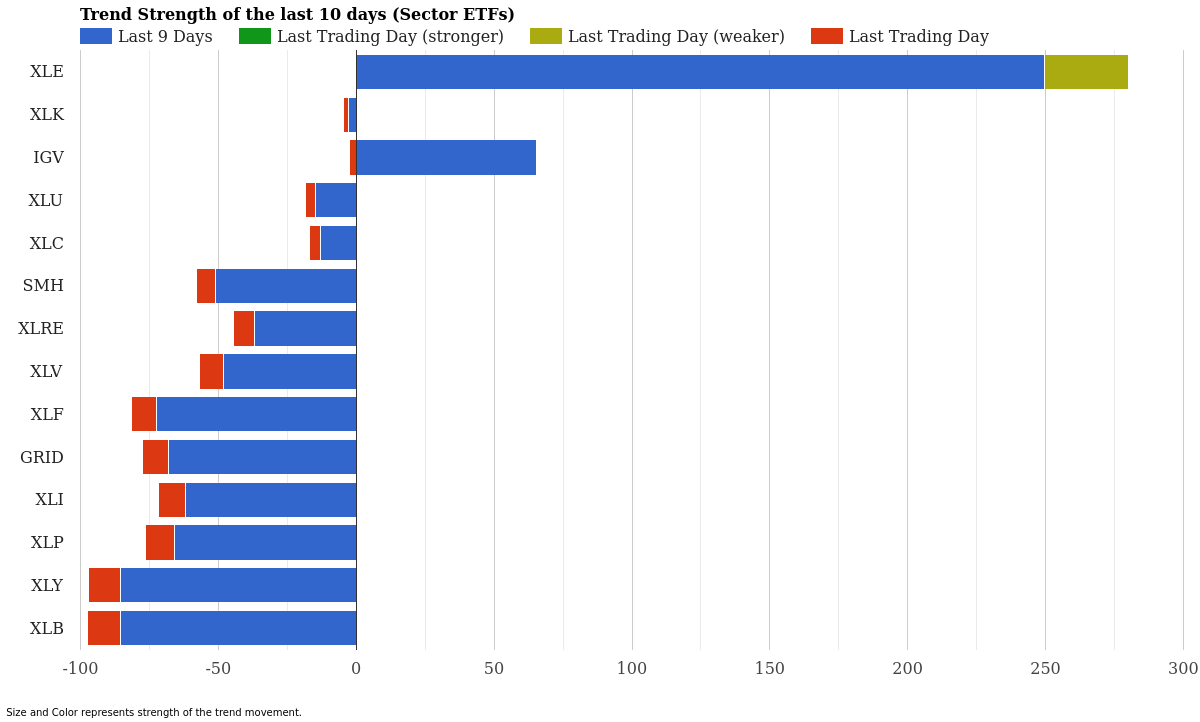
Sector ETF Trend Strength – Last 10 Days – March 31, 2026
Sector ETF Momentum Rankings
Energy dominates today’s landscape, though momentum is beginning to show signs of exhaustion. Technology and communication services remain under pressure, while industrials, consumer goods, and financials face the steepest declines.
| Rank | ETF | 10-Day Strength | Today’s Score | Signal |
|---|---|---|---|---|
| 1 | XLE | +249.50 | -30.71 | Weakening |
| 2 | IGV | +65.24 | -2.30 | Slowing |
| 3 | XLK | -2.95 | -1.73 | Downtrend |
| 4 | XLC | -12.80 | -4.14 | Downtrend |
| 5 | XLU | -14.65 | -3.85 | Downtrend |
| 6 | XLRE | -36.95 | -7.43 | Downtrend |
| 7 | XLV | -48.29 | -8.44 | Downtrend |
| 8 | SMH | -51.02 | -6.81 | Downtrend |
| 9 | XLI | -62.04 | -9.79 | Downtrend |
| 10 | XLP | -65.84 | -10.51 | Downtrend |
| 11 | GRID | -68.09 | -9.54 | Downtrend |
| 12 | XLF | -72.58 | -9.05 | Downtrend |
| 13 | XLB | -85.39 | -12.00 | Downtrend |
| 14 | XLY | -85.63 | -11.55 | Downtrend |
XLE energy stands alone with a massive momentum score of +249.50 across the last nine days. However, the tide is turning-today’s session produced a score of -30.71, signaling weakening momentum despite the strong overall trend. This reversal suggests the energy rally may be hitting resistance.
Every other sector faces headwinds. XLY (consumer discretionary) and XLB (materials) are the weakest performers with momentum scores near -85, indicating sustained selling pressure. Financials (XLF), industrials (XLI), and consumer staples (XLP) all show consistent downward momentum, with today’s losses ranging from -9 to -12.
Healthcare (XLV) and semiconductors (SMH) remain troubled, with neither showing signs of recovery. This broad weakness across cyclical and defensive sectors alike points to significant portfolio repositioning away from domestic growth and into commodities.
Commodity ETF Momentum Rankings
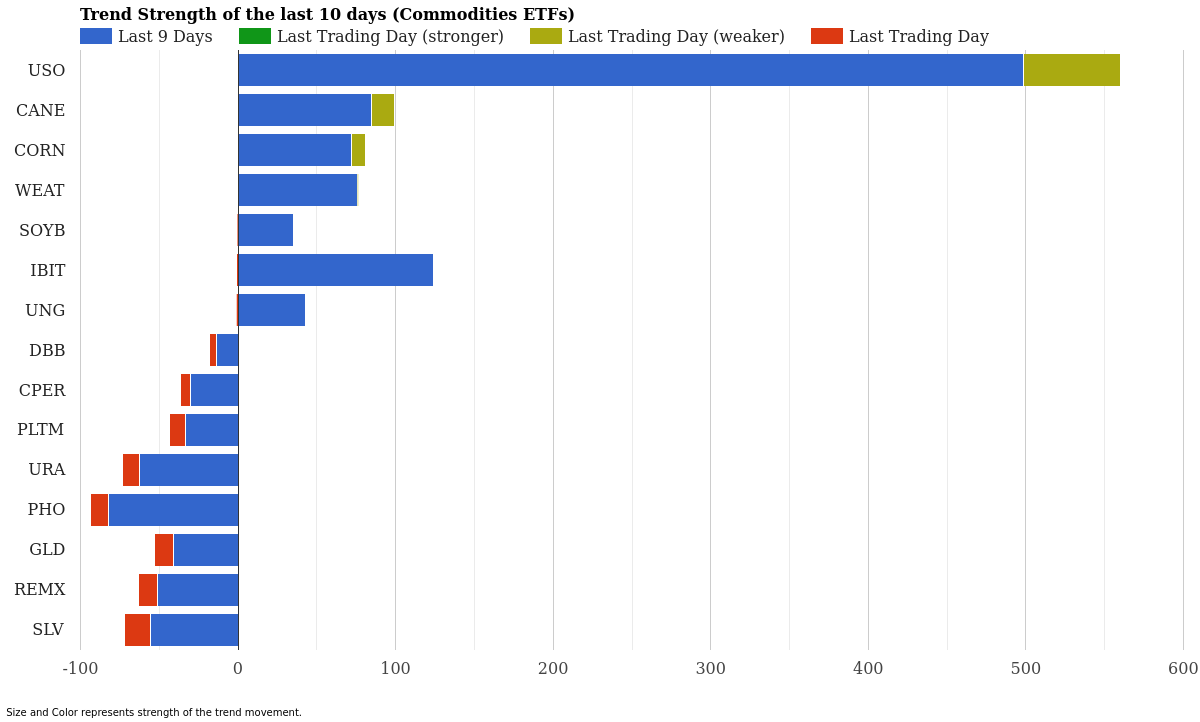
Commodity ETF Trend Strength – Last 10 Days – March 31, 2026
Commodity markets reveal a starkly different picture than equities. Energy and agricultural futures are fueling impressive momentum gains, though fatigue is setting in across the board.
| Rank | ETF | 10-Day Strength | Today’s Score | Signal |
|---|---|---|---|---|
| 1 | USO | +498.39 | -61.60 | Weakening |
| 2 | IBIT | +124.08 | -0.76 | Slowing |
| 3 | CANE | +84.97 | -14.58 | Weakening |
| 4 | WEAT | +75.92 | -0.00 | Weakening |
| 5 | CORN | +71.80 | -8.91 | Weakening |
| 6 | UNG | +43.06 | -1.06 | Slowing |
| 7 | SOYB | +34.90 | -0.49 | Slowing |
| 8 | DBB | -13.66 | -4.62 | Downtrend |
| 9 | CPER | -29.90 | -6.80 | Downtrend |
| 10 | PLTM | -33.24 | -10.49 | Downtrend |
| 11 | GLD | -40.97 | -11.77 | Downtrend |
| 12 | REMX | -51.41 | -11.90 | Downtrend |
| 13 | SLV | -55.79 | -16.20 | Downtrend |
| 14 | URA | -62.40 | -10.85 | Downtrend |
| 15 | PHO | -81.99 | -11.49 | Downtrend |
USO crude oil leads with an extraordinary momentum score of +498.39-the strongest performer across both sectors and commodities. Yet today’s weakness tells an important story: a score of -61.60 represents significant momentum erosion. This pattern mirrors XLE and suggests profit-taking may be underway in energy.
Agricultural commodities (CANE, WEAT, CORN) show impressive nine-day momentum scores between +71 and +84, but all are weakening with today’s modest negative scores. Bitcoin proxy IBIT holds a solid +124.08 with only minimal weakness-unusual resilience for a risk asset.
Precious metals and uranium are crushed. Silver (SLV) posted the worst single-session score of -16.20, while uranium (URA) and water (PHO) face persistent selling. Gold (GLD) adds to the carnage with a -11.77 score. This suggests investors are fleeing safe-haven and inflation-hedge assets.
Market Context & Interpretation
What’s happening beneath the surface is a significant rotation away from both defensive and speculative positions. Energy is winning-but showing fatigue. Equities across all sectors are losing. Commodities are split between strength (energy and agriculture) and weakness (metals and industrial chemicals).
The story here is about inflation expectations. The strength in oil and agricultural futures suggests markets are pricing in tighter supply dynamics or stronger global demand. Meanwhile, precious metals are being sold, which typically happens when real interest rates rise or when investors shift away from inflation hedges toward income-generating assets. The weakness in financials contradicts this narrative slightly-banks usually benefit from rising rates-suggesting something else is at work.
Semiconductor and tech weakness is notable. Both SMH and XLK are in sustained downtrends. This could reflect concerns about capital expenditure cycles, valuations, or economic growth. The consistent pressure on consumer discretionary (XLY) and materials (XLB) paints a picture of slowing growth expectations or demand destruction.
Bitcoin’s relative resilience (IBIT) is intriguing. While most risk assets decline, cryptocurrency-linked momentum remains positive, suggesting some investors view digital assets as an alternative to traditional equities rather than a pure risk-on play.
Key ETFs to Watch
Top 3 Strongest Performers:
USO dominates with exceptional momentum, but watch for continued weakness as the -61.60 score signals potential consolidation or reversal. XLE energy remains powerful but is weakening fast-a break below -10 tomorrow would confirm a trend change. IBIT bitcoin is the surprise winner, holding gains while other risk assets crumble.
Trend Reversals to Monitor:
All commodity leaders (USO, CANE, WEAT, CORN) show weakening signals. If this pattern persists through the next trading session, it could signal the end of the commodity rally. Watch for confirmation tomorrow. XLE’s move from +249 to -31 in a single day is dramatic-this needs to stabilize or it breaks the entire trade.
Weakest with Continued Downside Risk:
XLY (consumer discretionary), XLB (materials), and SLV (silver) show no signs of stabilization. Momentum scores are deeply negative, today’s contribution adds to the damage, and there’s no technical floor in sight. These are areas to avoid or consider for contrarian positioning if you expect a bounce.
Conclusion
March 31, 2026 presents a market in transition. Energy and commodities led the past week, but momentum is rolling over. Equities remain under pressure across nearly every sector, with no safe harbor visible. The data suggests institutional money is rotating between commodities rather than from equities into commodities-which explains why breadth is so poor.
For traders, the key insight is fatigue. Positions that looked unstoppable a few days ago (USO, XLE, agricultural ETFs) are now showing exhaustion. This is often where trends either consolidate or reverse. Don’t assume momentum continues-watch for confirmation or reversal signals in the next session.
For longer-term investors, the sustained weakness in tech, financials, and consumer sectors bears monitoring. If this continues, it may signal a more fundamental shift in economic expectations rather than a temporary correction.
Disclaimer: This report is provided for informational purposes only and does not constitute investment advice, a recommendation, or an offer to buy or sell any security. StockBotty ETF momentum scores are analytical tools derived from price action data and should not be relied upon as the sole basis for investment decisions. Past momentum does not guarantee future results. All investments carry risk, including potential loss of principal. Cryptocurrency assets are highly volatile and speculative. Consult a qualified financial advisor before making investment decisions. Positions and holdings can change without notice.
Author Disclosure: The author may hold or has held positions in ETF-related instruments, commodity futures, or derivative constructs tied to the assets mentioned in this report. These positions may change at any time. This analysis is provided as educational content and market commentary. It is not a trading recommendation or endorsement of any ETF or investment strategy. Readers should conduct independent research and consult with licensed advisors before trading.
For more market analysis visit stockbotty.com | Full Disclaimer
—
More Momentum & Strength Articles
SHLD, GDX Lead as Utilities Plunge – Momentum August 22
Cybersecurity Climbs as Utilities Fade - August 22, 2026 Executive Summary Sector momentum shows ...
Aug 22, 2026Financials Lead, Utilities Collapse – August 21, 2026
Financials Lead as Utilities Collapse - August 21, 2026 Executive Summary Capital is rotating har...
Aug 21, 2026Commodities Lead as Sectors Fade – Momentum Rankings August 20
Commodities Surge as Tech Retreats - August 20, 2026 Executive Summary Commodity ETFs are command...
Aug 20, 2026Financials Lead as Utilities Collapse – August 19, 2026
Financials Lead as Utilities Slide - August 19, 2026 Capital is flowing into established financia...
Aug 19, 2026Financials Lead, Biotech Flips – ETF Momentum August 18
Financials Lead as Biotech Stalls - August 18, 2026 Executive Summary XLF (Financials) dominates ...
Aug 18, 2026