
Energy Surges While Tech Stumbles: ETF Momentum Shifts on April 11, 2026
Executive Summary
April 11, 2026 painted a tale of extreme sector divergence, with energy leading a broad reversal rally while technology and consumer discretionary sectors continued their downward spiral. Across our tracked sector ETFs, 13 out of 14 showed negative momentum trends over the last nine days, yet 12 of those posted reversal signals yesterday-suggesting potential turning points are emerging. Energy (XLE) dominated with a remarkable momentum score of +220.50, though yesterday’s session showed signs of moderation. Meanwhile, commodities presented an equally dramatic picture: oil (USO) exploded with a +581.37 momentum score despite weakening yesterday, while precious metals and industrial commodities struggled across the board.
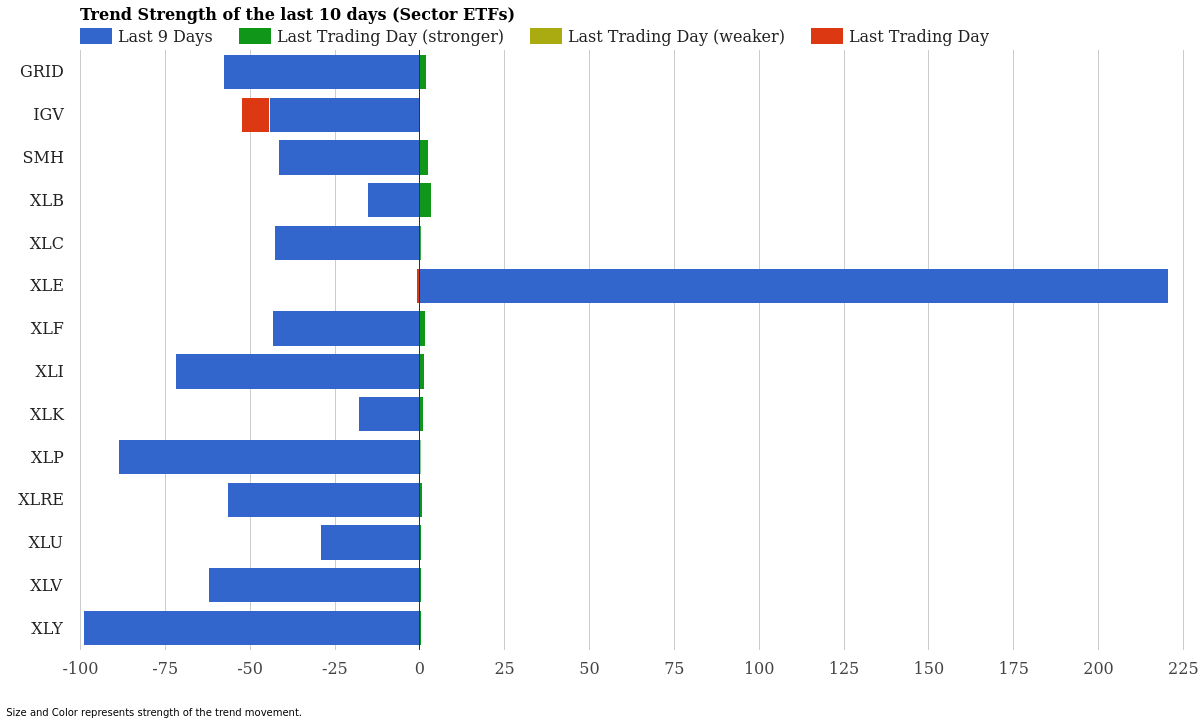
Sector ETF Trend Strength – Last 10 Days – April 11, 2026
Sector ETF Momentum Rankings
| Rank | ETF | 10-Day Strength | Today’s Signal | Status |
|---|---|---|---|---|
| 1 | XLE | +220.50 | -1.04 | Slowing |
| 2 | XLB | -15.35 | +3.52 | Reversal |
| 3 | XLK | -18.16 | +1.01 | Reversal |
| 4 | XLU | -29.42 | +0.40 | Reversal |
| 5 | SMH | -41.70 | +2.54 | Reversal |
| 6 | XLC | -42.96 | +0.30 | Reversal |
| 7 | XLF | -43.50 | +1.64 | Reversal |
| 8 | IGV | -44.21 | -8.47 | Downtrend |
| 9 | XLRE | -56.64 | +0.91 | Reversal |
| 10 | GRID | -57.79 | +1.82 | Reversal |
| 11 | XLV | -62.29 | +0.45 | Reversal |
| 12 | XLI | -72.09 | +1.31 | Reversal |
| 13 | XLP | -88.82 | +0.18 | Reversal |
| 14 | XLY | -99.25 | +0.34 | Reversal |
The sector story is unmistakable: broad weakness met with broad hope. Energy (XLE) stands alone with a commanding momentum score of +220.50, reflecting weeks of upward pressure in oil and related investments. However, yesterday’s negative signal of -1.04 hints that this rally may be catching its breath.
What’s particularly striking is the reversal pattern sweeping through the rest of the market. Every sector except energy and technology showed significant negative momentum over the past nine days, yet 12 of the 14 sector ETFs posted positive daily signals yesterday. Materials (XLB), semiconductors (SMH), financials (XLF), and utilities (XLU) all flashed reversal signals-suggesting potential turning points after extended declines. These aren’t explosive bounces, but they represent meaningful directional shifts from downtrend to recovery momentum.
Real estate (XLRE) and the power grid (GRID) also reversed despite steep nine-day declines of -56.64 and -57.79 respectively. Consumer discretionary (XLY) remains the sector’s worst performer with a nine-day momentum score of -99.25, yet it too reversed yesterday. The lone exception: cloud and tech infrastructure (IGV) continued its deterioration with both weak nine-day momentum (-44.21) and a sharply negative daily signal (-8.47).
Commodity ETF Momentum Rankings
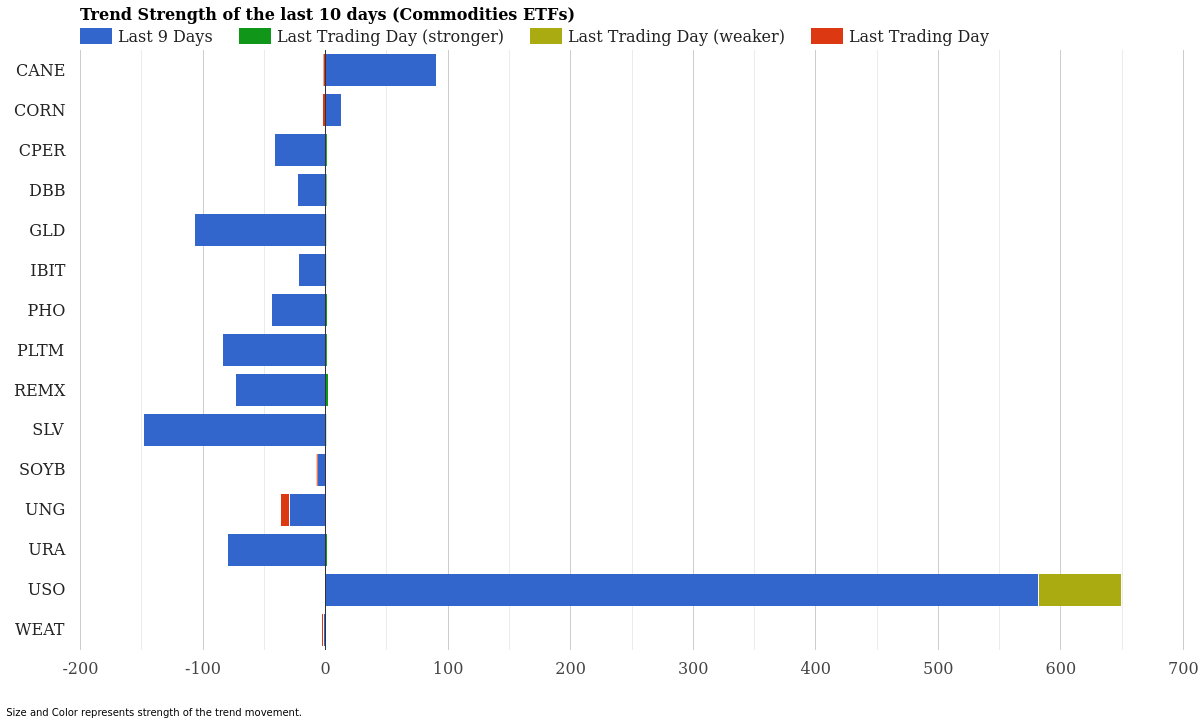
Commodity ETF Trend Strength – Last 10 Days – April 11, 2026
| Rank | ETF | 10-Day Strength | Today’s Signal | Status |
|---|---|---|---|---|
| 1 | USO | +581.37 | -68.37 | Weakening |
| 2 | CANE | +90.37 | -2.11 | Slowing |
| 3 | CORN | +12.73 | -2.16 | Slowing |
| 4 | WEAT | -1.64 | -1.45 | Downtrend |
| 5 | SOYB | -6.45 | -1.00 | Downtrend |
| 6 | IBIT | -22.16 | +0.16 | Reversal |
| 7 | DBB | -23.23 | +0.79 | Reversal |
| 8 | UNG | -29.17 | -7.88 | Downtrend |
| 9 | CPER | -42.08 | +1.04 | Reversal |
| 10 | PHO | -43.90 | +1.75 | Reversal |
| 11 | REMX | -73.23 | +2.17 | Reversal |
| 12 | URA | -79.67 | +1.61 | Reversal |
| 13 | PLTM | -83.85 | +1.04 | Reversal |
| 14 | GLD | -106.78 | +0.46 | Reversal |
| 15 | SLV | -148.40 | +0.48 | Reversal |
Oil dominates the commodity picture in an almost surreal fashion. USO’s momentum score of +581.37 is simply extraordinary-reflecting months of built-up buying pressure. Yet yesterday’s sharp negative signal of -68.37 sends a clear warning: this rally has exhausted itself at least temporarily. Energy traders may want to monitor whether this reversal sticks or whether oil finds fresh buyers at lower levels.
Agricultural commodities (CANE at +90.37, CORN at +12.73) tell a different story: both are still positive but visibly losing steam, as evidenced by negative daily signals of -2.11 and -2.16 respectively. Wheat (WEAT) and soybeans (SOYB) have already surrendered entirely, posting both weak nine-day scores and continued downward pressure yesterday.
The most intriguing commodity signals come from precious metals and rare earth miners. Silver (SLV) with a stunning negative momentum of -148.40 reversed yesterday (+0.48), along with gold (GLD at -106.78 reversing to +0.46). Rare earth miners (REMX) and uranium (URA) both flashed reversal signals despite nine-day declines of -73.23 and -79.67. These deeply oversold positions attract contrarian traders, and yesterday’s simultaneous reversals suggest accumulation is beginning among value hunters.
Market Context & Interpretation
What we’re witnessing is a tale of two markets colliding head-on. Energy and commodities have experienced an exceptional nine-day rally, driven by geopolitical tensions and traditional supply concerns. Meanwhile, nearly every traditional equity sector has endured weeks of weakness-particularly consumer discretionary, healthcare, and industrials.
Yesterday marked an inflection point. While energy’s slowing momentum suggests the oil rally may cool, the simultaneous reversal across 12 sector ETFs indicates broad-based repositioning away from weakness. This pattern typically precedes either a multi-day bounce or a more sustained recovery phase. Markets rarely exhibit this level of directional consistency without follow-through.
The commodity story is equally telling. Extreme weakness in precious metals (especially silver at -148.40) after weeks of selling often signals capitulation-the final stage before a rebound. Bitcoin exposure (IBIT) also showed reversal, hinting that traders are nibbling on depressed risk assets. Agricultural commodities remain weaker despite earlier strength in CANE and CORN, suggesting selective interest rather than broad commodity enthusiasm.
Interest rates and dollar strength likely explain much of this divergence. Higher-for-longer rate expectations typically boost energy producers and suppress discretionary spending. The recent daily reversals suggest rate expectations may be moderating or profit-taking is finally reaching extreme levels.
Key ETFs to Watch
Strongest Momentum Continues: XLE (Energy) remains the market’s clear winner with +220.50 momentum, though yesterday’s negative signal warrants close observation. USO (Oil) at +581.37 is in genuine bubble territory and highly vulnerable to overnight reversals. If energy falters, the sector reversal rally may lose its psychological fuel.
Critical Reversals to Monitor: SMH (Semiconductors) and XLB (Materials) both reversed strongly yesterday, suggesting institutional accumulation into weakness. If these patterns persist over the next 2-3 trading days, it signals genuine sector rotation away from energy and toward growth. Watch REMX and URA for signs of smart money entering deeply beaten-down resource stocks.
Weakness to Avoid: IGV (Cloud Computing) continues deteriorating with both negative nine-day momentum (-44.21) and a sharp negative daily signal (-8.47). XLY (Consumer Discretionary) at -99.25 remains battered, though yesterday’s tiny reversal suggests we may be nearing capitulation. UNG (Natural Gas) also refuses to stabilize despite yesterday’s weakness.
Conclusion
April 11, 2026 crystallizes a market in transition. Energy’s explosive momentum run appears to be moderating, yet the synchronized reversal across most equity sectors suggests broader buying is now emerging at depressed valuations. This combination often precedes meaningful multi-week recoveries-but confirmation requires follow-through over the next several sessions.
The dramatic weakness in precious metals and oversold commodities creates classic contrarian setups for disciplined traders. Meanwhile, the technology sector’s continued isolation (particularly IGV) may finally be approaching an inflection point, especially if broader sector reversals gain traction.
For portfolio managers, the question is clear: does yesterday’s reversal activity represent the start of a genuine sector rotation, or merely a technical bounce in a downtrend? The answer should emerge within days. Until then, monitor SMH, XLB, REMX, and SLV for confirmation signals.
For more market analysis visit stockbotty.com | Disclaimer: stockbotty.com/disclaimer
More Momentum & Strength Articles
SHLD, GDX Lead as Utilities Plunge – Momentum August 22
Cybersecurity Climbs as Utilities Fade - August 22, 2026 Executive Summary Sector momentum shows ...
Aug 22, 2026Financials Lead, Utilities Collapse – August 21, 2026
Financials Lead as Utilities Collapse - August 21, 2026 Executive Summary Capital is rotating har...
Aug 21, 2026Commodities Lead as Sectors Fade – Momentum Rankings August 20
Commodities Surge as Tech Retreats - August 20, 2026 Executive Summary Commodity ETFs are command...
Aug 20, 2026Financials Lead as Utilities Collapse – August 19, 2026
Financials Lead as Utilities Slide - August 19, 2026 Capital is flowing into established financia...
Aug 19, 2026Financials Lead, Biotech Flips – ETF Momentum August 18
Financials Lead as Biotech Stalls - August 18, 2026 Executive Summary XLF (Financials) dominates ...
Aug 18, 2026